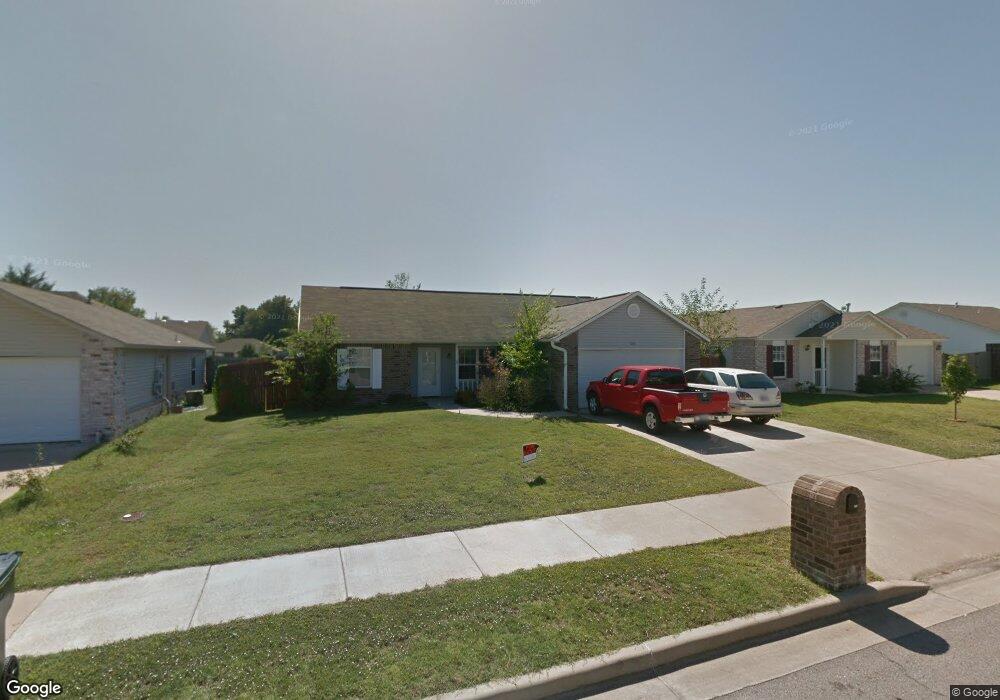
1111 W 22nd St N Claremore, OK 74017
Estimated Value: $201,997 - $207,000
3
Beds
2
Baths
1,302
Sq Ft
$157/Sq Ft
Est. Value
About This Home
This home is located at 1111 W 22nd St N, Claremore, OK 74017 and is currently estimated at $204,499, approximately $157 per square foot. 1111 W 22nd St N is a home located in Rogers County with nearby schools including Roosa Elementary School, Will Rogers Junior High School, and Claremore High School.
Ownership History
Date
Name
Owned For
Owner Type
Purchase Details
Closed on
Dec 18, 2023
Sold by
Sherry A Froman Living Trust
Bought by
Cary F Froman Living Trust and Froman
Current Estimated Value
Purchase Details
Closed on
Nov 25, 2016
Sold by
Whaley William T and Whaley Saphronia G
Bought by
Sherry A Froman Living Trust
Purchase Details
Closed on
Aug 31, 2007
Sold by
Rader Tadd L and Rader Shannon R
Bought by
Whaley William T and Whaley Saphronia G
Home Financials for this Owner
Home Financials are based on the most recent Mortgage that was taken out on this home.
Original Mortgage
$88,800
Interest Rate
6.72%
Mortgage Type
New Conventional
Purchase Details
Closed on
May 2, 2003
Sold by
Housing Authority Of
Purchase Details
Closed on
Oct 15, 2002
Sold by
Greco Properties Inc
Create a Home Valuation Report for This Property
The Home Valuation Report is an in-depth analysis detailing your home's value as well as a comparison with similar homes in the area
Home Values in the Area
Average Home Value in this Area
Purchase History
| Date | Buyer | Sale Price | Title Company |
|---|---|---|---|
| Cary F Froman Living Trust | -- | None Listed On Document | |
| Sherry A Froman Living Trust | $108,000 | Apex Title & Closing Service | |
| Whaley William T | $111,000 | Land Title Closing Services | |
| -- | $93,000 | -- | |
| -- | $167,500 | -- |
Source: Public Records
Mortgage History
| Date | Status | Borrower | Loan Amount |
|---|---|---|---|
| Previous Owner | Whaley William T | $88,800 |
Source: Public Records
Tax History Compared to Growth
Tax History
| Year | Tax Paid | Tax Assessment Tax Assessment Total Assessment is a certain percentage of the fair market value that is determined by local assessors to be the total taxable value of land and additions on the property. | Land | Improvement |
|---|---|---|---|---|
| 2025 | $1,452 | $15,704 | $3,334 | $12,370 |
| 2024 | $1,382 | $14,956 | $3,175 | $11,781 |
| 2023 | $1,382 | $14,244 | $3,101 | $11,143 |
| 2022 | $1,256 | $13,565 | $2,694 | $10,871 |
| 2021 | $1,141 | $13,050 | $2,750 | $10,300 |
| 2020 | $1,127 | $12,304 | $2,200 | $10,104 |
| 2019 | $1,104 | $11,925 | $2,200 | $9,725 |
| 2018 | $1,134 | $12,275 | $2,200 | $10,075 |
| 2017 | $1,118 | $12,175 | $2,200 | $9,975 |
| 2016 | $1,200 | $12,780 | $2,200 | $10,580 |
| 2015 | $1,157 | $12,475 | $2,200 | $10,275 |
| 2014 | $1,151 | $12,413 | $2,200 | $10,213 |
Source: Public Records
Map
Nearby Homes
- 1907 N Chambers Ave
- 1112 W 20th St
- 1012 W 22nd St
- 1005 W 23rd St
- 1103 W 20th St
- 1110 W 24th St N
- 1908 N Chambers Terrace
- 1503 Cedarwood Dr
- 1506 Cedarwood Dr
- 1505 Cedarwood Dr
- 1504 Cedarwood Dr
- 825 W 23rd St N
- 1404 Oakhurst Cir
- 1507 Cedarwood Dr
- 817 W 24th St N
- 1605 Pinecrest Dr
- 1603 Pinecrest Dr
- 809 W 24th St N
- 1509 Pinecrest Dr
- 1606 N Chambers Terrace
- 1111 W 22nd St
- 1113 W 22nd St
- 1109 W 22nd St
- 1115 W 22nd St
- 1110 W 21st St
- 1110 W 22nd St
- 1112 W 22nd St
- 1107 N 22nd St
- 1108 W 22nd St
- 1107 W 22nd St
- 1112 W 21st St
- 2220 W 21st St N
- 1108 W 21st St
- 1114 W 21st St N
- 1106 W 21st St N
- 1106 W 22nd St
- 1114 W 21st St
- 2314 W 21st N
- 1106 W 22nd St N
- 1105 W 22nd St