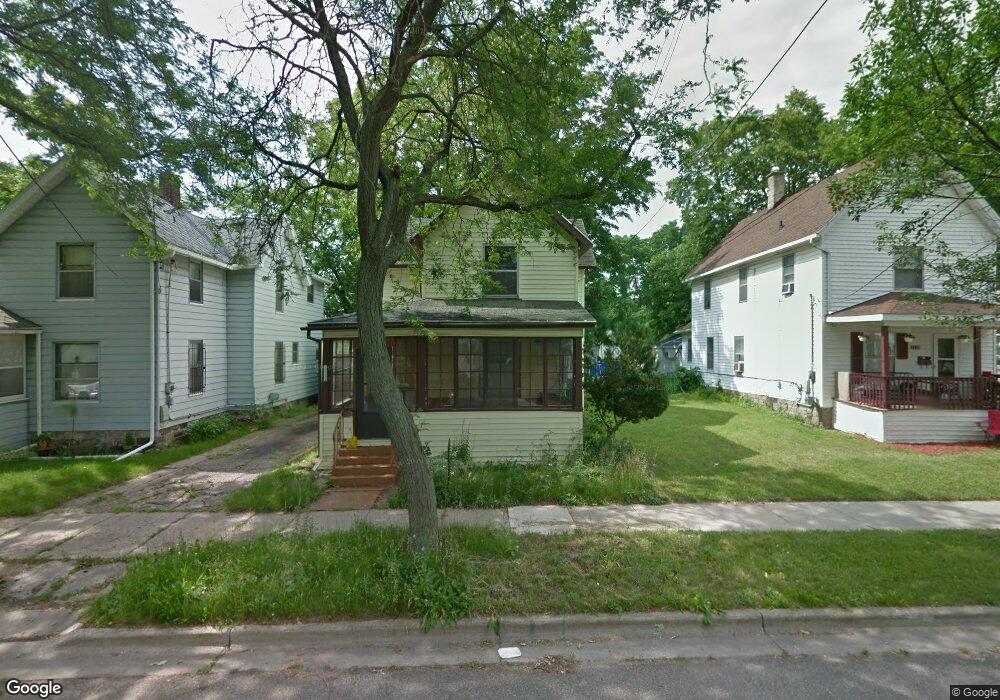
1111 W Washtenaw St Lansing, MI 48915
Westside NeighborhoodEstimated Value: $144,000 - $159,000
4
Beds
2
Baths
1,570
Sq Ft
$97/Sq Ft
Est. Value
About This Home
This home is located at 1111 W Washtenaw St, Lansing, MI 48915 and is currently estimated at $152,238, approximately $96 per square foot. 1111 W Washtenaw St is a home located in Ingham County with nearby schools including Riddle Elementary School, Pattengill Academy, and J.W. Sexton High School.
Ownership History
Date
Name
Owned For
Owner Type
Purchase Details
Closed on
Mar 23, 2015
Sold by
Rosner Brooke
Bought by
The House Of Transformation
Current Estimated Value
Purchase Details
Closed on
Feb 26, 2015
Sold by
Mathews Doris E
Bought by
Risner Brooke
Purchase Details
Closed on
Sep 7, 2011
Sold by
Chapman Sandra M and Crawford Ruby Dell
Bought by
Mathews Doris
Create a Home Valuation Report for This Property
The Home Valuation Report is an in-depth analysis detailing your home's value as well as a comparison with similar homes in the area
Home Values in the Area
Average Home Value in this Area
Purchase History
| Date | Buyer | Sale Price | Title Company |
|---|---|---|---|
| The House Of Transformation | $10,000 | None Available | |
| Risner Brooke | $10,000 | None Available | |
| Mathews Doris | $6,800 | Parks Title |
Source: Public Records
Tax History Compared to Growth
Tax History
| Year | Tax Paid | Tax Assessment Tax Assessment Total Assessment is a certain percentage of the fair market value that is determined by local assessors to be the total taxable value of land and additions on the property. | Land | Improvement |
|---|---|---|---|---|
| 2025 | $3,176 | $68,400 | $4,200 | $64,200 |
| 2024 | $26 | $64,900 | $4,200 | $60,700 |
| 2023 | $2,988 | $52,900 | $4,200 | $48,700 |
| 2022 | $2,728 | $48,500 | $3,200 | $45,300 |
| 2021 | $2,665 | $43,000 | $4,700 | $38,300 |
| 2020 | $2,646 | $39,600 | $4,700 | $34,900 |
| 2019 | $2,557 | $38,100 | $4,700 | $33,400 |
| 2018 | $2,424 | $33,600 | $4,700 | $28,900 |
| 2017 | $5,542 | $33,600 | $4,700 | $28,900 |
| 2016 | $4,289 | $30,400 | $4,700 | $25,700 |
| 2015 | $4,289 | $29,100 | $9,384 | $19,716 |
| 2014 | $4,289 | $29,200 | $12,500 | $16,700 |
Source: Public Records
Map
Nearby Homes
- 1128 W Washtenaw St
- 1128 W Lenawee St
- 1140 W Lenawee St
- 1234 W Allegan St
- 1128 W Michigan Ave
- 1232 W Michigan Ave
- 1319 W Michigan Ave
- 1309 W Lenawee St
- 201 S Jenison Ave
- 1314 W Ottawa St
- 602 S Jenison Ave
- 312 N Butler Blvd
- 416 N Martin Luther King Junior Blvd
- 418 N Martin Luther King Junior Blvd
- 422 N Martin Luther King Junior Blvd
- 1804 W Michigan Ave
- 817 Middle St
- 325 N Sycamore St
- 1017 W Genesee St
- 425/425.5 N Butler Blvd
- 1109 W Washtenaw St
- 1109 W Washtenaw St Unit 1
- 1109 W Washtenaw St Unit .5
- 1115 W Washtenaw St
- 308 S Mlk Blvd
- 1119 W Washtenaw St
- 314 S Martin Luther King jr Blvd
- 314 S Martin Luther King jr Blvd Unit 2
- 314 S Martin Luther King jr Blvd Unit 1
- 314 S Mlk Blvd
- 1114 W Washtenaw St
- 1121 W Washtenaw St
- 316 S Martin Luther King Junior Blvd Unit 2
- 1116 W Washtenaw St
- 1123 W Washtenaw St
- 1114 Kingsley Ct
- 1118 W Washtenaw St
- 1120 W Washtenaw St Unit 1
- 1115 Kingsley Ct
- 224 S Martin Luther King jr Blvd