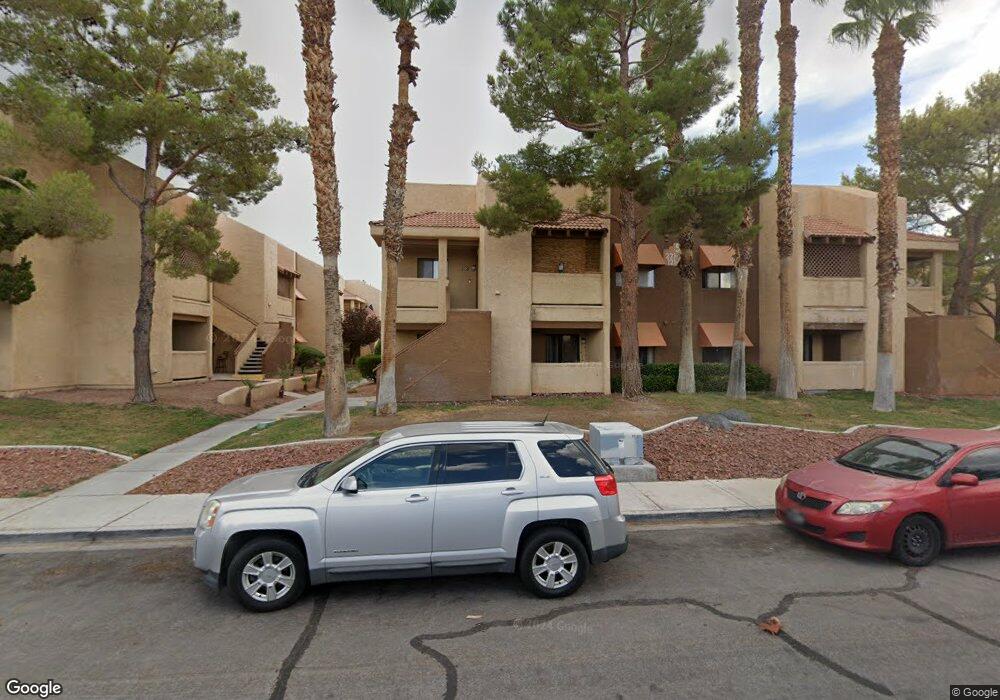
1111 Warbonnet Way Unit 110 Las Vegas, NV 89117
Canyon Gate NeighborhoodEstimated Value: $128,000 - $190,000
1
Bed
1
Bath
571
Sq Ft
$282/Sq Ft
Est. Value
About This Home
This home is located at 1111 Warbonnet Way Unit 110, Las Vegas, NV 89117 and is currently estimated at $161,006, approximately $281 per square foot. 1111 Warbonnet Way Unit 110 is a home located in Clark County with nearby schools including Herbert A. Derfelt Elementary School, Walter Johnson Junior High School Academy of International Studies, and Bonanza High School.
Ownership History
Date
Name
Owned For
Owner Type
Purchase Details
Closed on
May 23, 2014
Sold by
Yazdinian Farhad and Yazdinian Mojgan
Bought by
Eleven Condos Llc
Current Estimated Value
Purchase Details
Closed on
Jan 31, 2011
Sold by
Fannie Mae
Bought by
Yazdinian Farhad
Purchase Details
Closed on
Sep 27, 2010
Sold by
Briones Nolician
Bought by
Fannie Mae and Federal National Mortgage Association
Purchase Details
Closed on
Aug 16, 2007
Sold by
Santa Fe 124 Llc
Bought by
Briones Nolician
Home Financials for this Owner
Home Financials are based on the most recent Mortgage that was taken out on this home.
Original Mortgage
$129,900
Interest Rate
6.62%
Mortgage Type
Purchase Money Mortgage
Create a Home Valuation Report for This Property
The Home Valuation Report is an in-depth analysis detailing your home's value as well as a comparison with similar homes in the area
Home Values in the Area
Average Home Value in this Area
Purchase History
| Date | Buyer | Sale Price | Title Company |
|---|---|---|---|
| Eleven Condos Llc | $344,046 | Ticor Title Las Vegas | |
| Yazdinian Farhad | $35,000 | Lawyers Title Of Nevada Hen | |
| Fannie Mae | $112,749 | None Available | |
| Briones Nolician | $129,900 | Commonwealth Title |
Source: Public Records
Mortgage History
| Date | Status | Borrower | Loan Amount |
|---|---|---|---|
| Previous Owner | Briones Nolician | $129,900 |
Source: Public Records
Tax History Compared to Growth
Tax History
| Year | Tax Paid | Tax Assessment Tax Assessment Total Assessment is a certain percentage of the fair market value that is determined by local assessors to be the total taxable value of land and additions on the property. | Land | Improvement |
|---|---|---|---|---|
| 2025 | $533 | $24,035 | $10,203 | $13,832 |
| 2024 | $494 | $24,035 | $10,203 | $13,832 |
| 2023 | $494 | $20,652 | $7,700 | $12,952 |
| 2022 | $458 | $19,261 | $7,175 | $12,086 |
| 2021 | $424 | $18,004 | $7,175 | $10,829 |
| 2020 | $391 | $18,096 | $7,175 | $10,921 |
| 2019 | $366 | $17,908 | $7,000 | $10,908 |
| 2018 | $350 | $17,020 | $6,300 | $10,720 |
| 2017 | $568 | $17,337 | $6,300 | $11,037 |
| 2016 | $329 | $17,523 | $6,300 | $11,223 |
| 2015 | $327 | $9,647 | $4,550 | $5,097 |
| 2014 | $316 | $9,642 | $4,200 | $5,442 |
Source: Public Records
Map
Nearby Homes
- 8005 Sandmark Dr
- 7803 Canoe Ln
- 1000 Grammy Dr
- 1004 Sun Wood Dr
- 7933 Settlers Ridge Ln
- 840 Yacht Harbor Dr Unit 202
- 7905 Greycrest Ct Unit 201
- 8000 Clock Tower Ct
- 7905 Lago Vista Ln Unit 203
- 7820 Ravenhollow Ln Unit 11812
- 7814 Gable Ln Unit 12112
- 8013 Tribal Cir
- 8201 Boseck Dr
- 717 Wheat Ridge Ln Unit 102
- 717 Wheat Ridge Ln Unit 103
- 8324 W Charleston Blvd Unit 2002
- 8324 W Charleston Blvd Unit 1047
- 8324 W Charleston Blvd Unit 2010
- 8324 W Charleston Blvd Unit 2033
- 8324 W Charleston Blvd Unit 1003
- 1111 Warbonnet Way Unit 221
- 1111 Warbonnet Way Unit 208
- 1111 Warbonnet Way Unit 238
- 1111 Warbonnet Way Unit 121
- 1111 Warbonnet Way Unit 109
- 1111 Warbonnet Way Unit 222
- 1111 Warbonnet Way Unit 218
- 1111 Warbonnet Way Unit 130
- 1111 Warbonnet Way Unit 246
- 1111 Warbonnet Way Unit 201
- 1111 Warbonnet Way Unit 220
- 1111 Warbonnet Way Unit 219
- 1111 Warbonnet Way Unit 245
- 1111 Warbonnet Way Unit 244
- 1111 Warbonnet Way Unit 243
- 1111 Warbonnet Way Unit 146
- 1111 Warbonnet Way Unit 145
- 1111 Warbonnet Way Unit 144
- 1111 Warbonnet Way Unit 143
- 1111 Warbonnet Way Unit 242