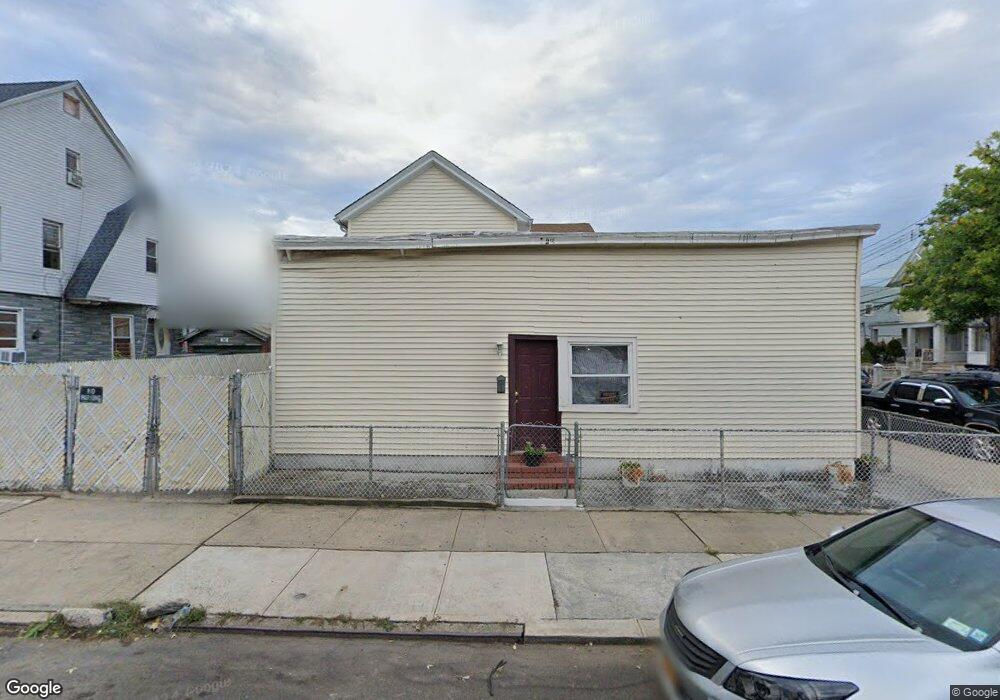
11116 91st Ave Richmond Hill, NY 11418
Richmond Hill NeighborhoodEstimated Value: $882,621 - $968,000
--
Bed
--
Bath
1,892
Sq Ft
$496/Sq Ft
Est. Value
About This Home
This home is located at 11116 91st Ave, Richmond Hill, NY 11418 and is currently estimated at $938,655, approximately $496 per square foot. 11116 91st Ave is a home located in Queens County with nearby schools including P.S. 90 - Horace Mann, M.S.137 America's School of Heroes, and Richmond Hill High School.
Ownership History
Date
Name
Owned For
Owner Type
Purchase Details
Closed on
Nov 19, 2025
Sold by
Mongelli Ii Esq. - Referee Michael F
Bought by
Begum Shahana and Fortify Realty Llc
Current Estimated Value
Purchase Details
Closed on
Apr 15, 1998
Sold by
Cruz Teolinda
Bought by
Pascual Rufino and Pascual Antigua
Home Financials for this Owner
Home Financials are based on the most recent Mortgage that was taken out on this home.
Original Mortgage
$163,600
Interest Rate
7.11%
Mortgage Type
FHA
Create a Home Valuation Report for This Property
The Home Valuation Report is an in-depth analysis detailing your home's value as well as a comparison with similar homes in the area
Home Values in the Area
Average Home Value in this Area
Purchase History
| Date | Buyer | Sale Price | Title Company |
|---|---|---|---|
| Begum Shahana | $700,000 | -- | |
| Pascual Rufino | $165,000 | First American Title Ins Co |
Source: Public Records
Mortgage History
| Date | Status | Borrower | Loan Amount |
|---|---|---|---|
| Previous Owner | Pascual Rufino | $163,600 |
Source: Public Records
Tax History Compared to Growth
Tax History
| Year | Tax Paid | Tax Assessment Tax Assessment Total Assessment is a certain percentage of the fair market value that is determined by local assessors to be the total taxable value of land and additions on the property. | Land | Improvement |
|---|---|---|---|---|
| 2025 | $6,733 | $35,533 | $11,183 | $24,350 |
| 2024 | $6,733 | $33,523 | $11,057 | $22,466 |
| 2023 | $6,392 | $31,824 | $11,093 | $20,731 |
| 2022 | $6,353 | $47,100 | $16,920 | $30,180 |
| 2021 | $6,605 | $46,380 | $16,920 | $29,460 |
| 2020 | $6,268 | $43,980 | $16,920 | $27,060 |
| 2019 | $5,844 | $37,680 | $16,920 | $20,760 |
| 2018 | $5,406 | $26,520 | $16,920 | $9,600 |
| 2017 | $5,652 | $27,725 | $16,356 | $11,369 |
| 2016 | $5,229 | $27,725 | $16,356 | $11,369 |
| 2015 | $3,209 | $24,676 | $16,574 | $8,102 |
| 2014 | $3,209 | $23,280 | $18,780 | $4,500 |
Source: Public Records
Map
Nearby Homes