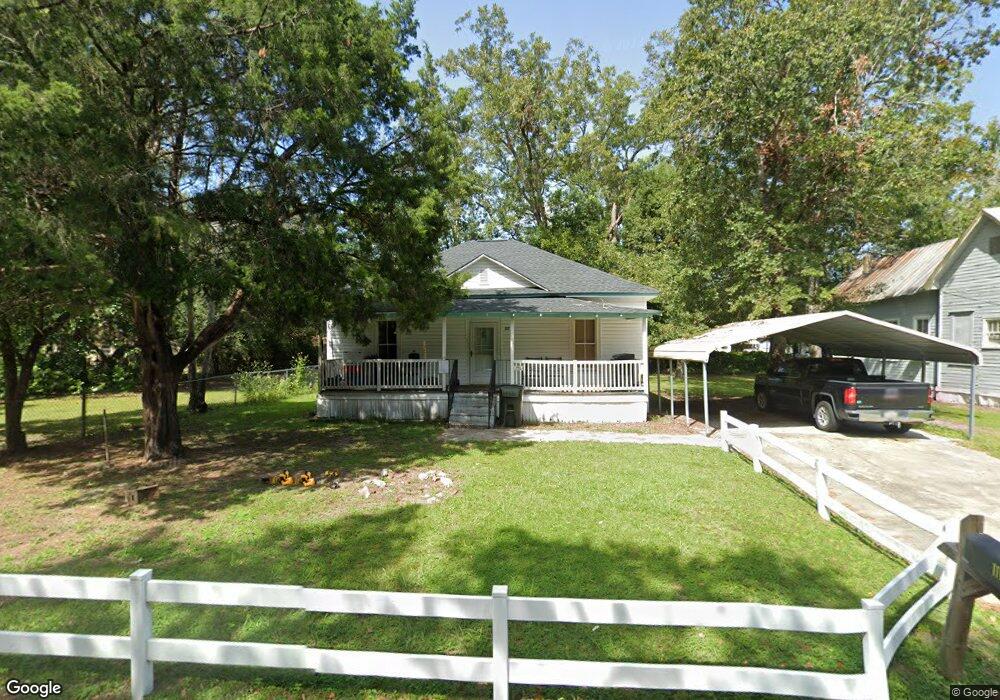
1112 Ann St Waycross, GA 31503
Estimated Value: $44,000 - $70,080
3
Beds
2
Baths
1,148
Sq Ft
$50/Sq Ft
Est. Value
About This Home
This home is located at 1112 Ann St, Waycross, GA 31503 and is currently estimated at $57,270, approximately $49 per square foot. 1112 Ann St is a home located in Ware County with nearby schools including Ruskin Elementary School, Ware County Middle School, and Ware County High School.
Ownership History
Date
Name
Owned For
Owner Type
Purchase Details
Closed on
Sep 29, 2023
Sold by
Deschenes Michael
Bought by
Cornerstone Real Estate Llc
Current Estimated Value
Home Financials for this Owner
Home Financials are based on the most recent Mortgage that was taken out on this home.
Original Mortgage
$35,500
Outstanding Balance
$32,655
Interest Rate
6.55%
Mortgage Type
New Conventional
Estimated Equity
$24,615
Purchase Details
Closed on
Jun 26, 2014
Sold by
Jacob I Tony
Bought by
Deschenes Michael
Purchase Details
Closed on
May 17, 2011
Sold by
Citimortgage Inc
Bought by
Great Investments Of Georgia Inc
Purchase Details
Closed on
Jan 4, 2011
Sold by
Citimortgage Inc
Bought by
Citimortgage Inc
Purchase Details
Closed on
Jun 8, 2005
Sold by
Lee Emanuel
Bought by
Tolbert John
Purchase Details
Closed on
Oct 24, 2002
Sold by
Welch Ralph J
Bought by
Lee Emanuel and Lee Freddy
Purchase Details
Closed on
Aug 27, 1985
Create a Home Valuation Report for This Property
The Home Valuation Report is an in-depth analysis detailing your home's value as well as a comparison with similar homes in the area
Home Values in the Area
Average Home Value in this Area
Purchase History
| Date | Buyer | Sale Price | Title Company |
|---|---|---|---|
| Cornerstone Real Estate Llc | $35,000 | -- | |
| Deschenes Michael | $25,000 | -- | |
| Great Investments Of Georgia Inc | $9,000 | -- | |
| Citimortgage Inc | $7,162 | -- | |
| Tolbert John | $8,000 | -- | |
| Lee Emanuel | $23,000 | -- | |
| -- | $6,500 | -- |
Source: Public Records
Mortgage History
| Date | Status | Borrower | Loan Amount |
|---|---|---|---|
| Open | Cornerstone Real Estate Llc | $35,500 |
Source: Public Records
Tax History Compared to Growth
Tax History
| Year | Tax Paid | Tax Assessment Tax Assessment Total Assessment is a certain percentage of the fair market value that is determined by local assessors to be the total taxable value of land and additions on the property. | Land | Improvement |
|---|---|---|---|---|
| 2024 | $402 | $12,817 | $1,110 | $11,707 |
| 2023 | $442 | $10,042 | $770 | $9,272 |
| 2022 | $380 | $9,538 | $770 | $8,768 |
| 2021 | $270 | $6,248 | $770 | $5,478 |
| 2020 | $182 | $6,146 | $770 | $5,376 |
| 2019 | $184 | $5,890 | $770 | $5,120 |
| 2018 | $186 | $5,634 | $770 | $4,864 |
| 2017 | $180 | $5,634 | $770 | $4,864 |
| 2016 | $180 | $5,634 | $770 | $4,864 |
| 2015 | $182 | $5,634 | $770 | $4,864 |
| 2014 | $247 | $5,634 | $770 | $4,864 |
| 2013 | -- | $5,634 | $770 | $4,864 |
Source: Public Records
Map
Nearby Homes
- 1103 Ann St
- 1208 Margaret St
- 1125 Georgia St
- 503 N Nicholls St
- 803 Elizabeth St
- 0 S Georgia Pkwy W
- 1322 Jane St
- 505 N Nicholls St
- 1003 Carswell Ave
- 506 McDonald St
- 605 Walker St
- 601 N Nicholls St
- 1401 Carswell Ave
- 0 Camp Branch Cross Rd Unit 12958956
- 0 Camp Branch Cross Rd Unit 147575
- 0 Camp Branch Cross Rd Unit 10127958
- 516 Folks St
- 1006 Roosevelt St
- 00 Roosevelt St
- 6905 Kendal Ct
- 1108 Ann St
- 1113 Margaret St
- 1115 Margaret St
- 1109 Margaret St
- 1117 Margaret St
- 1109 Ann St
- 1107 Margaret St
- 1111 Ann St
- 1106 Ann St
- 1113 Ann St
- 1105 Margaret St
- 1101 Margaret St
- 1112 Margaret St
- 1110 Margaret St
- 1108 Margaret St
- 300 Baker St
- 1114 Margaret St
- 1106 Margaret St
- 1120 Margaret St
- 1104 Margaret St