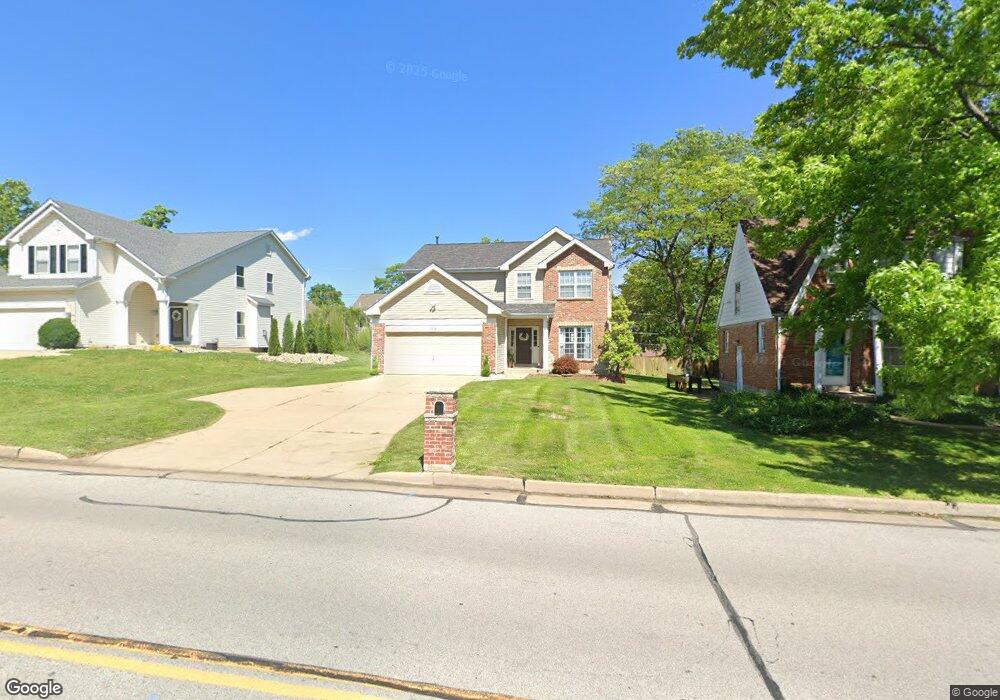
1112 Bopp Rd Saint Louis, MO 63131
Estimated Value: $615,000 - $697,000
4
Beds
3
Baths
2,330
Sq Ft
$290/Sq Ft
Est. Value
About This Home
This home is located at 1112 Bopp Rd, Saint Louis, MO 63131 and is currently estimated at $675,071, approximately $289 per square foot. 1112 Bopp Rd is a home located in St. Louis County with nearby schools including Westchester Elementary School, North Kirkwood Middle School, and Kirkwood Senior High School.
Ownership History
Date
Name
Owned For
Owner Type
Purchase Details
Closed on
Aug 27, 2010
Sold by
Bank Of America N A
Bought by
Degenhardt Tammy R
Current Estimated Value
Home Financials for this Owner
Home Financials are based on the most recent Mortgage that was taken out on this home.
Original Mortgage
$284,958
Outstanding Balance
$195,745
Interest Rate
5.25%
Mortgage Type
FHA
Estimated Equity
$479,326
Purchase Details
Closed on
Apr 12, 2010
Sold by
Mayer Custom Homes Inc
Bought by
Bank Of America N A
Purchase Details
Closed on
Oct 2, 2009
Sold by
Bruggeman Kathryne Ann
Bought by
Mayer Manors Inc
Home Financials for this Owner
Home Financials are based on the most recent Mortgage that was taken out on this home.
Original Mortgage
$45,000
Interest Rate
5.06%
Mortgage Type
Seller Take Back
Create a Home Valuation Report for This Property
The Home Valuation Report is an in-depth analysis detailing your home's value as well as a comparison with similar homes in the area
Home Values in the Area
Average Home Value in this Area
Purchase History
| Date | Buyer | Sale Price | Title Company |
|---|---|---|---|
| Degenhardt Tammy R | $240,000 | Investors Title Company | |
| Bank Of America N A | $322,050 | None Available | |
| Mayer Manors Inc | -- | None Available |
Source: Public Records
Mortgage History
| Date | Status | Borrower | Loan Amount |
|---|---|---|---|
| Open | Degenhardt Tammy R | $284,958 | |
| Previous Owner | Mayer Manors Inc | $45,000 |
Source: Public Records
Tax History Compared to Growth
Tax History
| Year | Tax Paid | Tax Assessment Tax Assessment Total Assessment is a certain percentage of the fair market value that is determined by local assessors to be the total taxable value of land and additions on the property. | Land | Improvement |
|---|---|---|---|---|
| 2025 | $6,663 | $116,450 | $48,220 | $68,230 |
| 2024 | $6,663 | $115,220 | $36,180 | $79,040 |
| 2023 | $6,560 | $115,220 | $36,180 | $79,040 |
| 2022 | $6,024 | $98,600 | $36,180 | $62,420 |
| 2021 | $5,960 | $98,600 | $36,180 | $62,420 |
| 2020 | $5,902 | $93,880 | $36,180 | $57,700 |
| 2019 | $5,910 | $93,880 | $36,180 | $57,700 |
| 2018 | $5,418 | $77,200 | $22,520 | $54,680 |
| 2017 | $5,432 | $77,200 | $22,520 | $54,680 |
| 2016 | $4,087 | $58,740 | $16,070 | $42,670 |
| 2015 | $4,092 | $58,740 | $16,070 | $42,670 |
| 2014 | $3,676 | $51,530 | $8,380 | $43,150 |
Source: Public Records
Map
Nearby Homes
- 1126 Bopp Rd
- 1090 Kinstern Dr
- 1029 Kinstern Dr
- 11909 Lillian Ave
- 11913 Lillian Ave
- 919 Nana Ln
- 896 Twin Pine Dr
- 12006 Montour Dr
- 811 Cherry St
- 1001 Dovergate Dr
- 918 N Ballas Rd
- 12224 TBB Roger Ln
- 8 Briarbrook Trail
- 946 Rochdale Dr
- 11358 Manchester Rd
- 1710 Lynkirk Ln
- 723 Oak Valley Dr
- 1737 Folkstone Dr
- 535 Kirkshire Dr
- 1003 Ormond Dr
- 1114 Bopp Rd
- 1125 Vinetta Dr
- 1116 Bopp Rd
- 1127 Vinetta Dr
- 1119 Vinetta Dr
- 1131 Vinetta Dr
- 1118 Bopp Rd
- 1115 Bopp Rd
- 1115 Vinetta Dr
- 1135 Vinetta Dr
- 1120 Bopp Rd
- 1139 Vinetta Dr
- 1124 Vinetta Dr
- 1126 Vinetta Dr
- 1120 Vinetta Dr
- 1130 Vinetta Dr
- 11900 Paradise Ln
- 1116 Vinetta Dr
- 1134 Vinetta Dr
- 1124 Bopp Rd