Estimated Value: $495,000 - $596,000
4
Beds
4
Baths
3,136
Sq Ft
$179/Sq Ft
Est. Value
About This Home
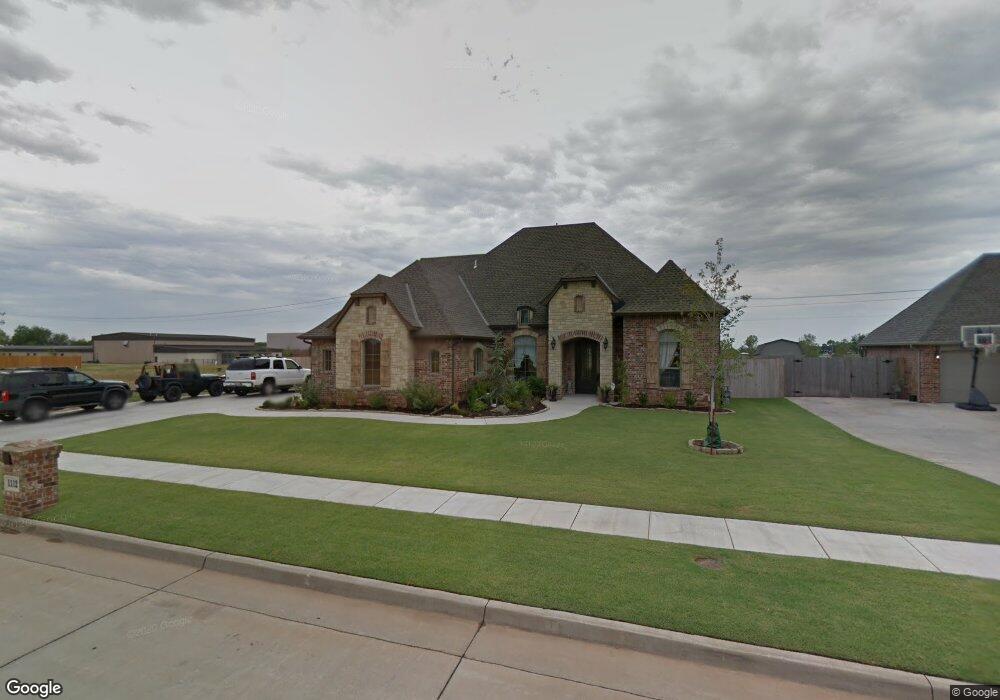
This home is located at 1112 Canteberry Dr, Yukon, OK 73099 and is currently estimated at $561,216, approximately $178 per square foot. 1112 Canteberry Dr is a home located in Canadian County with nearby schools including Skyview Elementary School, Lakeview Elementary School, and Yukon Middle School.
Ownership History
Date
Name
Owned For
Owner Type
Purchase Details
Closed on
Jul 8, 2019
Sold by
Bottrell Mark D and Bottrell Harriet B
Bought by
Allison Jamie D and Allison Tammy C
Current Estimated Value
Home Financials for this Owner
Home Financials are based on the most recent Mortgage that was taken out on this home.
Original Mortgage
$200,000
Outstanding Balance
$131,579
Interest Rate
3.9%
Mortgage Type
New Conventional
Estimated Equity
$429,637
Purchase Details
Closed on
Aug 25, 2010
Sold by
Richard Russell Homes Inc
Bought by
Bottrell Mark D and Bottrell Harriet B
Home Financials for this Owner
Home Financials are based on the most recent Mortgage that was taken out on this home.
Original Mortgage
$378,400
Interest Rate
4.6%
Mortgage Type
New Conventional
Purchase Details
Closed on
May 14, 2009
Sold by
United Investments
Bought by
Richard Russell Homes Inc
Create a Home Valuation Report for This Property
The Home Valuation Report is an in-depth analysis detailing your home's value as well as a comparison with similar homes in the area
Home Values in the Area
Average Home Value in this Area
Purchase History
| Date | Buyer | Sale Price | Title Company |
|---|---|---|---|
| Allison Jamie D | $455,000 | First American Title | |
| Bottrell Mark D | $398,500 | Fatco | |
| Richard Russell Homes Inc | $37,000 | Wta |
Source: Public Records
Mortgage History
| Date | Status | Borrower | Loan Amount |
|---|---|---|---|
| Open | Allison Jamie D | $200,000 | |
| Previous Owner | Bottrell Mark D | $378,400 |
Source: Public Records
Tax History Compared to Growth
Tax History
| Year | Tax Paid | Tax Assessment Tax Assessment Total Assessment is a certain percentage of the fair market value that is determined by local assessors to be the total taxable value of land and additions on the property. | Land | Improvement |
|---|---|---|---|---|
| 2024 | $5,898 | $57,101 | $5,910 | $51,191 |
| 2023 | $5,898 | $55,438 | $5,644 | $49,794 |
| 2022 | $5,749 | $53,824 | $5,412 | $48,412 |
| 2021 | $5,596 | $52,256 | $5,040 | $47,216 |
| 2020 | $5,860 | $55,341 | $5,040 | $50,301 |
| 2019 | $5,012 | $47,336 | $4,410 | $42,926 |
| 2018 | $4,878 | $45,957 | $4,410 | $41,547 |
| 2017 | $4,734 | $44,619 | $4,440 | $40,179 |
| 2016 | $4,595 | $44,619 | $4,440 | $40,179 |
| 2015 | $4,115 | $42,058 | $4,440 | $37,618 |
| 2014 | $4,115 | $38,332 | $4,440 | $33,892 |
Source: Public Records
Map
Nearby Homes
- 1129 Cambridge Dr
- 1300 Katelyn Ct
- 1144 Canteberry Dr
- 1100 Kingsway Ave
- 9213 NW 147th Terrace
- 9209 NW 147th Terrace
- 1324 Katelyn Ct
- 1409 Katelyn Ct
- 1408 Katelyn Ct
- 421 Switch Ct
- 1204 Excalibur Ct
- 1020 Majestic Ave
- 1004 Majestic Ave
- 11032 NW 21st St
- 1004 Ranchoak Ct
- 1321 Camelot Dr
- 1051 Royal Ln
- 1119 Oakwood Dr
- 11013 NW 19th St
- 1920 Sama Way
- 1225 E Vandament Ave
- 1116 Canteberry Dr
- 1108 Canteberry Dr
- 1109 Canteberry Dr
- 1113 Canteberry Dr
- 1104 Canteberry Dr
- 1120 Canteberry Dr
- 1205 Abbeywood Place
- 1121 Canteberry Dr
- 1124 Canteberry Dr
- 1108 Cambridge Dr
- 1112 Cambridge Dr
- 1100 Canteberry Dr
- 1104 Cambridge Dr
- 1116 Cambridge Dr
- 1125 Canteberry Dr
- 1100 Cambridge Dr
- 1128 Canteberry Dr
- 1120 Cambridge Dr
- 1208 Abbeywood Place