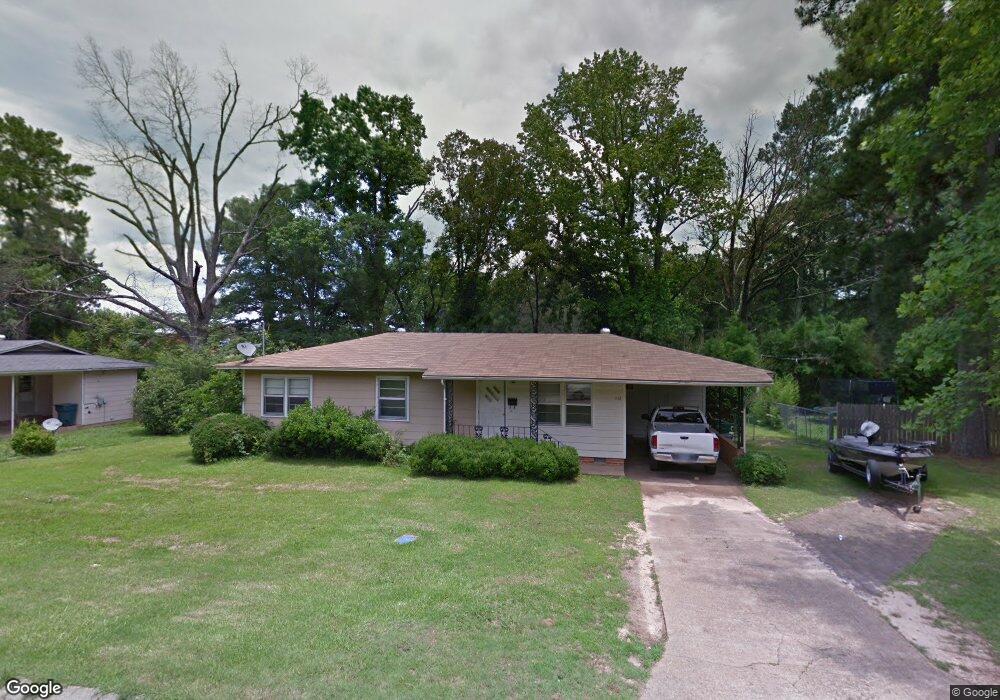
1112 Chestnut Magnolia, AR 71753
Estimated Value: $79,000 - $120,000
--
Bed
1
Bath
1,170
Sq Ft
$85/Sq Ft
Est. Value
About This Home
This home is located at 1112 Chestnut, Magnolia, AR 71753 and is currently estimated at $99,423, approximately $84 per square foot. 1112 Chestnut is a home located in Columbia County with nearby schools including East Side Elementary School, Central Elementary School, and Magnolia Junior High School.
Ownership History
Date
Name
Owned For
Owner Type
Purchase Details
Closed on
Jul 27, 2016
Sold by
Mccook Mitzi G
Bought by
Mccook Christopher L
Current Estimated Value
Purchase Details
Closed on
May 22, 2015
Sold by
Dixon Bryan Glenn
Bought by
Mccook Chris
Home Financials for this Owner
Home Financials are based on the most recent Mortgage that was taken out on this home.
Original Mortgage
$60,935
Interest Rate
3.68%
Mortgage Type
New Conventional
Purchase Details
Closed on
Aug 23, 2012
Sold by
Gorum Robert G and Gorum Marion
Bought by
Dixon Bryan Glenn
Home Financials for this Owner
Home Financials are based on the most recent Mortgage that was taken out on this home.
Original Mortgage
$57,850
Interest Rate
3.49%
Mortgage Type
New Conventional
Purchase Details
Closed on
Apr 4, 2011
Sold by
Gorum Betty Margaret Bailey
Bought by
Gorum Robert G
Purchase Details
Closed on
Dec 13, 2010
Sold by
Smith David T and Smith Carole Sue
Bought by
Bailey Betty
Create a Home Valuation Report for This Property
The Home Valuation Report is an in-depth analysis detailing your home's value as well as a comparison with similar homes in the area
Home Values in the Area
Average Home Value in this Area
Purchase History
| Date | Buyer | Sale Price | Title Company |
|---|---|---|---|
| Mccook Christopher L | -- | -- | |
| Mccook Chris | $67,000 | -- | |
| Dixon Bryan Glenn | -- | -- | |
| Gorum Robert G | -- | -- | |
| Bailey Betty | -- | -- |
Source: Public Records
Mortgage History
| Date | Status | Borrower | Loan Amount |
|---|---|---|---|
| Previous Owner | Mccook Chris | $60,935 | |
| Previous Owner | Dixon Bryan Glenn | $57,850 |
Source: Public Records
Tax History Compared to Growth
Tax History
| Year | Tax Paid | Tax Assessment Tax Assessment Total Assessment is a certain percentage of the fair market value that is determined by local assessors to be the total taxable value of land and additions on the property. | Land | Improvement |
|---|---|---|---|---|
| 2025 | $613 | $14,073 | $1,600 | $12,473 |
| 2024 | $516 | $14,073 | $1,600 | $12,473 |
| 2023 | $469 | $11,850 | $1,600 | $10,250 |
| 2022 | $158 | $11,850 | $1,600 | $10,250 |
| 2021 | $146 | $11,850 | $1,600 | $10,250 |
| 2020 | $469 | $11,850 | $1,600 | $10,250 |
| 2019 | $521 | $11,850 | $1,600 | $10,250 |
| 2018 | $189 | $11,850 | $1,600 | $10,250 |
| 2017 | $447 | $11,280 | $1,600 | $9,680 |
| 2016 | -- | $11,280 | $1,600 | $9,680 |
| 2015 | -- | $11,280 | $1,600 | $9,680 |
| 2013 | -- | $0 | $0 | $0 |
Source: Public Records
Map
Nearby Homes