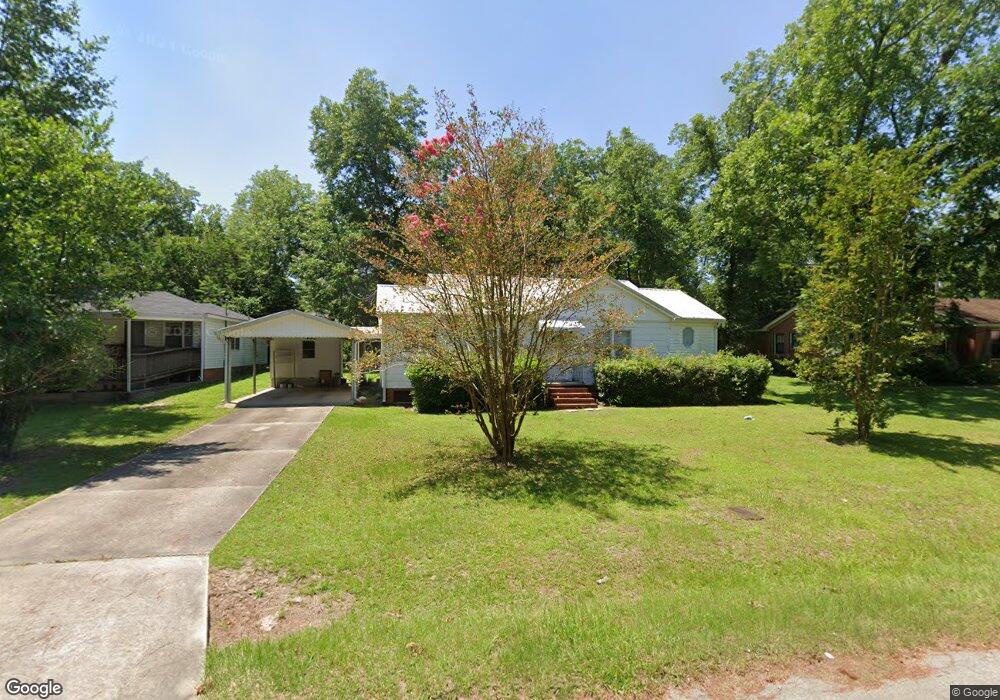
1112 E 19th Ave Cordele, GA 31015
Estimated Value: $85,402 - $128,000
2
Beds
1
Bath
1,204
Sq Ft
$84/Sq Ft
Est. Value
About This Home
This home is located at 1112 E 19th Ave, Cordele, GA 31015 and is currently estimated at $100,851, approximately $83 per square foot. 1112 E 19th Ave is a home located in Crisp County with nearby schools including Crisp County Elementary School, Crisp County Primary School, and Crisp County Middle School.
Ownership History
Date
Name
Owned For
Owner Type
Purchase Details
Closed on
Jun 3, 2008
Sold by
Black Jimmy E
Bought by
Kilcrease Thomas
Current Estimated Value
Home Financials for this Owner
Home Financials are based on the most recent Mortgage that was taken out on this home.
Original Mortgage
$40,000
Outstanding Balance
$7,987
Interest Rate
6.04%
Mortgage Type
New Conventional
Estimated Equity
$92,864
Purchase Details
Closed on
Jan 25, 2007
Sold by
Henderson Gwendolyn B
Bought by
Black Jimmy E and Black Wright A
Home Financials for this Owner
Home Financials are based on the most recent Mortgage that was taken out on this home.
Original Mortgage
$42,000
Interest Rate
6.14%
Mortgage Type
New Conventional
Purchase Details
Closed on
Jun 22, 2006
Sold by
Lovette Hazel Bryan
Bought by
Henderson Gwendolyn B
Purchase Details
Closed on
Aug 1, 1988
Bought by
Lovette Hazel B
Create a Home Valuation Report for This Property
The Home Valuation Report is an in-depth analysis detailing your home's value as well as a comparison with similar homes in the area
Purchase History
| Date | Buyer | Sale Price | Title Company |
|---|---|---|---|
| Kilcrease Thomas | $62,000 | -- | |
| Black Jimmy E | $42,000 | -- | |
| Henderson Gwendolyn B | -- | -- | |
| Lovette Hazel B | -- | -- |
Source: Public Records
Mortgage History
| Date | Status | Borrower | Loan Amount |
|---|---|---|---|
| Open | Kilcrease Thomas | $40,000 | |
| Previous Owner | Black Jimmy E | $42,000 |
Source: Public Records
Tax History
| Year | Tax Paid | Tax Assessment Tax Assessment Total Assessment is a certain percentage of the fair market value that is determined by local assessors to be the total taxable value of land and additions on the property. | Land | Improvement |
|---|---|---|---|---|
| 2025 | $531 | $27,167 | $2,005 | $25,162 |
| 2024 | $887 | $24,764 | $2,005 | $22,759 |
| 2023 | $883 | $23,562 | $2,005 | $21,557 |
| 2022 | $591 | $22,361 | $2,005 | $20,356 |
| 2021 | $579 | $21,159 | $2,005 | $19,154 |
| 2020 | $596 | $21,159 | $2,005 | $19,154 |
| 2019 | $600 | $21,159 | $2,005 | $19,154 |
| 2018 | $571 | $19,361 | $2,721 | $16,640 |
| 2017 | $786 | $19,361 | $2,721 | $16,640 |
| 2016 | $573 | $19,361 | $2,721 | $16,640 |
| 2015 | -- | $19,361 | $2,721 | $16,640 |
| 2014 | -- | $19,361 | $2,721 | $16,640 |
| 2013 | -- | $19,361 | $2,720 | $16,640 |
Source: Public Records
Map
Nearby Homes
- 709 Fleming Rd
- 1304 Robin St
- 1001 Stewart Ave
- 912 Rose Ln
- 1206 Fleming Rd
- 120 Edgewood Dr
- 1509 E 20th Ave
- 1002 Camellia Dr
- 720 E 20th Ave
- E 8th Ave
- 716 E 18th Ave
- 715 E 17th Ave
- TBD N Pecan St
- 812 E 14th Ave
- 1410 E 24th Ave
- 807 E 14th Ave
- 1506 E 24th Ave
- 1614 Pryor Way
- 1018 E 28th Ave
- 1603 Pine Acres Dr
- 902 Broad St
- 1110 E 19th Ave
- 1113 E 20th Ave
- 1115 E 20th Ave
- 1109 E 19th Ave
- 1106 E 19th Ave
- 1115 E 19th Ave Unit A
- 1105 E 20th Ave
- 1105 E 19th Ave
- 1102 E 19th Ave
- 1101 E 19th Ave
- 1101 E 20th Ave
- 803 S Pecan St
- 1108 E 18th Ave Unit E
- 802 Broad St
- 1102 E 20th Ave
- 1104 E 20th Ave
- 1016 E 19th Ave
- 1027 E 20th Ave
- 1027 E 20th Ave
Your Personal Tour Guide
Ask me questions while you tour the home.