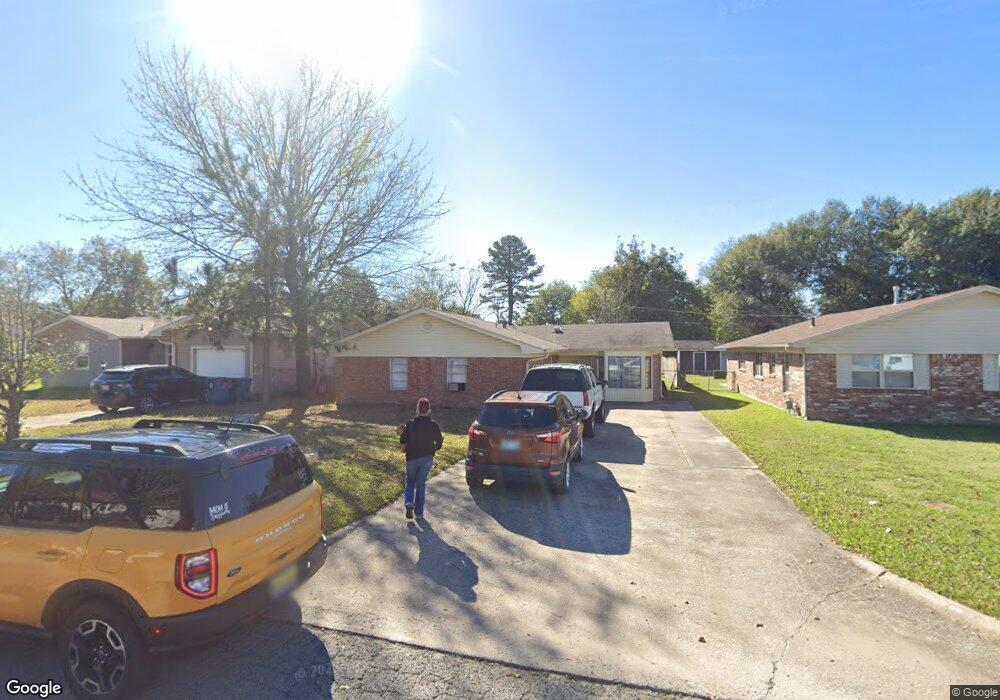
1112 E Kiowa Ave McAlester, OK 74501
Estimated Value: $125,985 - $160,000
3
Beds
3
Baths
1,488
Sq Ft
$98/Sq Ft
Est. Value
About This Home
This home is located at 1112 E Kiowa Ave, McAlester, OK 74501 and is currently estimated at $146,246, approximately $98 per square foot. 1112 E Kiowa Ave is a home located in Pittsburg County with nearby schools including McAlester High School, Mcalester Christian Academy, and Lakewood Christian School.
Create a Home Valuation Report for This Property
The Home Valuation Report is an in-depth analysis detailing your home's value as well as a comparison with similar homes in the area
Home Values in the Area
Average Home Value in this Area
Tax History Compared to Growth
Tax History
| Year | Tax Paid | Tax Assessment Tax Assessment Total Assessment is a certain percentage of the fair market value that is determined by local assessors to be the total taxable value of land and additions on the property. | Land | Improvement |
|---|---|---|---|---|
| 2025 | $563 | $6,406 | $722 | $5,684 |
| 2024 | $563 | $6,101 | $688 | $5,413 |
| 2023 | $535 | $5,810 | $656 | $5,154 |
| 2022 | $485 | $5,534 | $630 | $4,904 |
| 2021 | $482 | $5,534 | $630 | $4,904 |
| 2020 | $440 | $5,020 | $582 | $4,438 |
| 2019 | $385 | $5,019 | $587 | $4,432 |
| 2018 | $368 | $4,553 | $533 | $4,020 |
| 2017 | $353 | $4,336 | $507 | $3,829 |
| 2016 | $173 | $4,130 | $377 | $3,753 |
| 2015 | $158 | $4,130 | $377 | $3,753 |
| 2014 | $158 | $4,130 | $377 | $3,753 |
Source: Public Records
Map
Nearby Homes
- 617 S 12th St
- 1204 E Comanche Ave
- 610 S Strong Blvd
- 703 S 12th St
- 415 S 12th St
- 0 E Seminole Ave
- 1304 E Delaware Ave Unit 1
- 1004 E Osage Ave
- 0 S 14th St
- 903 E Wyandotte
- 800 S 9th St
- 803 E Delaware Ave
- 1504 E Comanche Ave
- 724 E Delaware Ave
- 1508 E Comanche Ave
- 1507 E Seminole Ave
- 1401 E South Ave
- 810 E Miami Ave
- 621 E Seminole Ave
- 1504 E Miami Ave
- 1108 E Kiowa Ave
- 1116 E Kiowa Ave
- 521 S 12th St
- 1104 E Kiowa Ave
- 523 S 12th St
- 518 S Strong Blvd
- 500 S Strong Blvd
- 1105 E Kiowa Ave
- 421 S 12th St
- 525 S 12th St
- 1103 E Kiowa Ave
- 420 S Strong Blvd
- 520 S Strong Blvd
- 527 S 12th St
- 1202 E Kiowa Ave
- 418 S Strong Blvd
- 420 S 12th St
- 1024 E Kiowa Ave
- 529 S 12th St
- 524 S Strong Blvd