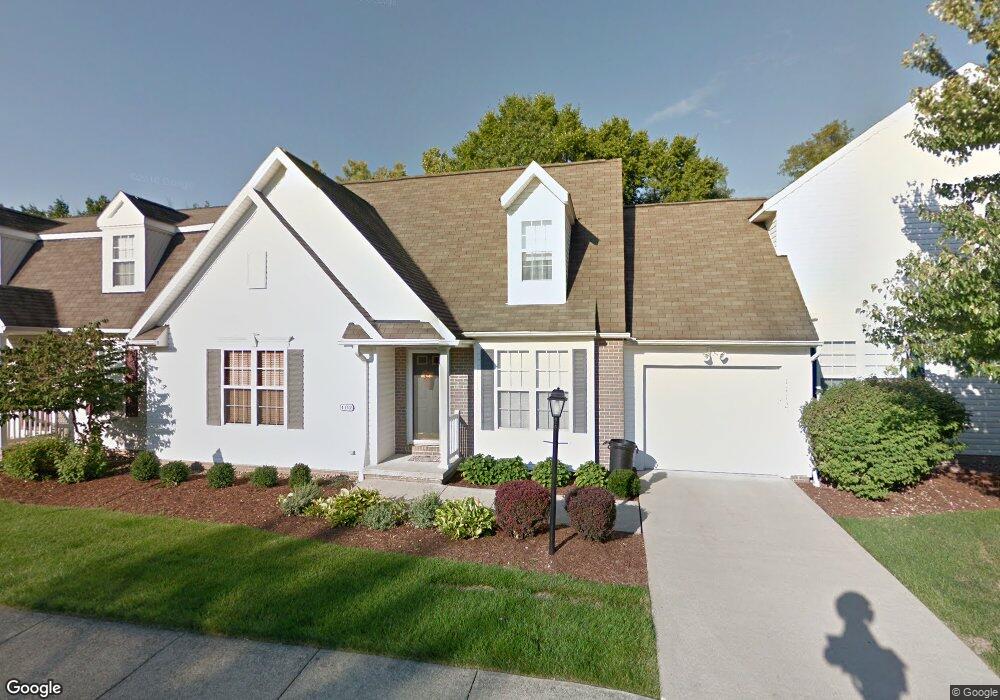
1112 Glencove Commons Brunswick, OH 44212
Estimated Value: $270,000 - $336,000
2
Beds
2
Baths
1,487
Sq Ft
$200/Sq Ft
Est. Value
About This Home
This home is located at 1112 Glencove Commons, Brunswick, OH 44212 and is currently estimated at $297,055, approximately $199 per square foot. 1112 Glencove Commons is a home located in Medina County with nearby schools including Hickory Ridge Elementary School, Willets Middle School, and Brunswick High School.
Ownership History
Date
Name
Owned For
Owner Type
Purchase Details
Closed on
Jun 26, 2006
Sold by
Sklenka Karilyn E
Bought by
Ozello Agnes M
Current Estimated Value
Home Financials for this Owner
Home Financials are based on the most recent Mortgage that was taken out on this home.
Original Mortgage
$33,100
Interest Rate
6.68%
Mortgage Type
Stand Alone Second
Purchase Details
Closed on
Dec 4, 2003
Sold by
Gaynor Mary E and The Mary E Gaynor Revocable Li
Bought by
Sklenka Karilyn E
Home Financials for this Owner
Home Financials are based on the most recent Mortgage that was taken out on this home.
Original Mortgage
$114,800
Interest Rate
5.12%
Mortgage Type
Purchase Money Mortgage
Purchase Details
Closed on
Jul 19, 2000
Sold by
Knight Development Corp
Bought by
Gaynor Mary E and The Mary E Gaynor Revocable Living Tr
Create a Home Valuation Report for This Property
The Home Valuation Report is an in-depth analysis detailing your home's value as well as a comparison with similar homes in the area
Home Values in the Area
Average Home Value in this Area
Purchase History
| Date | Buyer | Sale Price | Title Company |
|---|---|---|---|
| Ozello Agnes M | $165,500 | -- | |
| Sklenka Karilyn E | $143,500 | -- | |
| Gaynor Mary E | $127,100 | -- |
Source: Public Records
Mortgage History
| Date | Status | Borrower | Loan Amount |
|---|---|---|---|
| Closed | Ozello Agnes M | $33,100 | |
| Previous Owner | Sklenka Karilyn E | $114,800 | |
| Closed | Sklenka Karilyn E | $28,700 |
Source: Public Records
Tax History Compared to Growth
Tax History
| Year | Tax Paid | Tax Assessment Tax Assessment Total Assessment is a certain percentage of the fair market value that is determined by local assessors to be the total taxable value of land and additions on the property. | Land | Improvement |
|---|---|---|---|---|
| 2024 | $3,548 | $71,760 | $19,850 | $51,910 |
| 2023 | $3,548 | $71,760 | $19,850 | $51,910 |
| 2022 | $3,356 | $71,760 | $19,850 | $51,910 |
| 2021 | $2,971 | $56,950 | $15,750 | $41,200 |
| 2020 | $2,673 | $56,950 | $15,750 | $41,200 |
| 2019 | $2,674 | $56,950 | $15,750 | $41,200 |
| 2018 | $2,509 | $50,680 | $10,930 | $39,750 |
| 2017 | $2,512 | $50,680 | $10,930 | $39,750 |
| 2016 | $2,510 | $50,680 | $10,930 | $39,750 |
| 2015 | $2,403 | $46,930 | $10,120 | $36,810 |
| 2014 | $2,395 | $46,930 | $10,120 | $36,810 |
| 2013 | $2,342 | $46,930 | $10,120 | $36,810 |
Source: Public Records
Map
Nearby Homes
- 1044-1070 Pearl Rd
- 4383 Inner Circle Dr Unit C24
- 4383 Inner Circle Dr Unit A24
- 4385 Inner Circle Dr Unit B-18
- 4383 Inner Circle Dr Unit B22
- 4349 Inner Circle Dr Unit A-5
- 4347 Oak Ridge Trail
- 4351 Oak Ridge Trail
- 4355 Oak Ridge Trail
- 4339 Oak Ridge Trail
- V/L Pearl Rd
- 0 Pearl Rd Unit 4173749
- 4203 Regal Ave
- 1291 Jester Ct Unit B253
- 1307 Stearns St
- 4597 Brushwood Cir
- 1407 Lincoln Ave
- 1151 Mulberry Ln
- 4340 Oak Ridge Trail
- 858 Quinebaug Ct
- 1116 Glencove Commons
- 1108 Glencove Commons
- 1120 Glencove Commons
- 1113 Glencove Commons
- 1117 Glencove Commons
- 1109 Glencove Commons
- 1121 Glencove Commons
- 1128 Glencove Commons
- 1132 Glencove Commons
- 1107 Manitoulin Pike
- 1127 Glencove Commons
- 1117 Manitoulin Pike
- 1131 Glencove Commons
- 1136 Glencove Commons
- 1127 Manitoulin Pike
- 1135 Glencove Commons
- 4385 Hickory Ridge Ave
- 1140 Glencove Commons
- 4375 Hickory Ridge Ave
- 1139 Glencove Commons