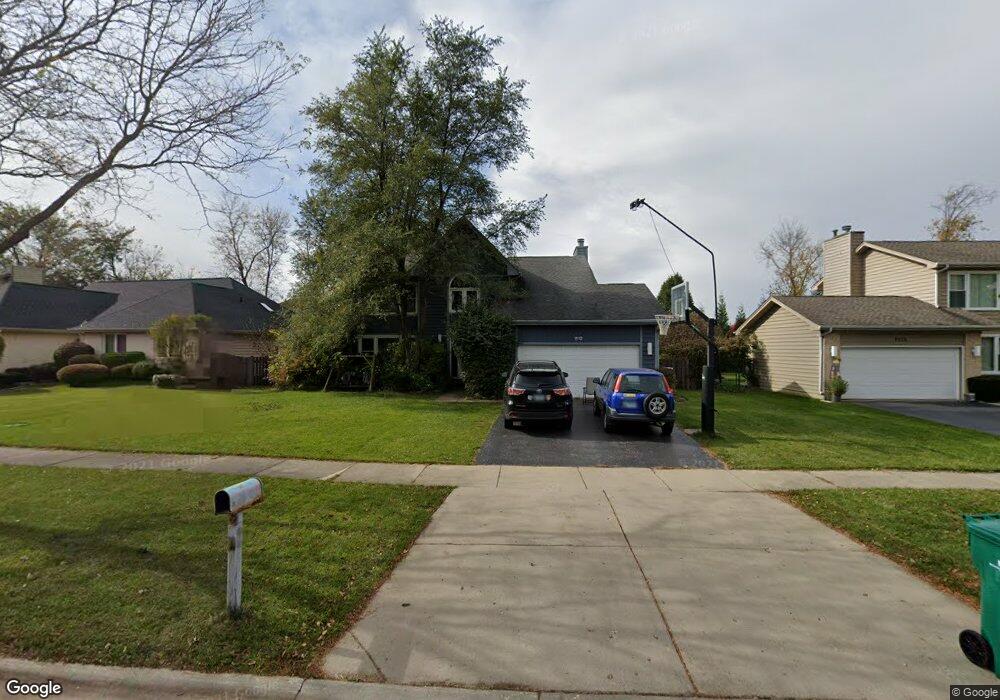
1112 Hidden Lake Dr Buffalo Grove, IL 60089
Estimated Value: $668,000 - $701,000
4
Beds
3
Baths
2,928
Sq Ft
$235/Sq Ft
Est. Value
About This Home
This home is located at 1112 Hidden Lake Dr, Buffalo Grove, IL 60089 and is currently estimated at $688,477, approximately $235 per square foot. 1112 Hidden Lake Dr is a home located in Lake County with nearby schools including Meridian Middle School, Tripp Elementary School, and Aptakisic Junior High School.
Ownership History
Date
Name
Owned For
Owner Type
Purchase Details
Closed on
May 28, 2002
Sold by
Schuhl Robert J and The Robert J Schuhl Revocable
Bought by
Brickman Alex and Brickman Jennifer
Current Estimated Value
Home Financials for this Owner
Home Financials are based on the most recent Mortgage that was taken out on this home.
Original Mortgage
$300,000
Interest Rate
6.54%
Purchase Details
Closed on
Jan 14, 2000
Sold by
Schuhl Robert J and Baren Schuhl Rodelle
Bought by
Schuhl Robert J and Schuhl Rodelle
Purchase Details
Closed on
Jan 12, 1994
Sold by
Dreyfuss Robert L and Dreyfuss Lynn
Bought by
Schuhl Robert J and Baren Schuhl Rodelle
Home Financials for this Owner
Home Financials are based on the most recent Mortgage that was taken out on this home.
Original Mortgage
$275,000
Interest Rate
6.37%
Create a Home Valuation Report for This Property
The Home Valuation Report is an in-depth analysis detailing your home's value as well as a comparison with similar homes in the area
Home Values in the Area
Average Home Value in this Area
Purchase History
| Date | Buyer | Sale Price | Title Company |
|---|---|---|---|
| Brickman Alex | $430,000 | Commonwealth Land Title Ins | |
| Schuhl Robert J | -- | -- | |
| Schuhl Robert J | $230,000 | -- |
Source: Public Records
Mortgage History
| Date | Status | Borrower | Loan Amount |
|---|---|---|---|
| Previous Owner | Brickman Alex | $300,000 | |
| Previous Owner | Schuhl Robert J | $275,000 |
Source: Public Records
Tax History Compared to Growth
Tax History
| Year | Tax Paid | Tax Assessment Tax Assessment Total Assessment is a certain percentage of the fair market value that is determined by local assessors to be the total taxable value of land and additions on the property. | Land | Improvement |
|---|---|---|---|---|
| 2024 | $16,163 | $174,797 | $42,665 | $132,132 |
| 2023 | $14,140 | $164,934 | $40,258 | $124,676 |
| 2022 | $14,140 | $150,729 | $36,791 | $113,938 |
| 2021 | $13,639 | $149,103 | $36,394 | $112,709 |
| 2020 | $13,373 | $149,612 | $36,518 | $113,094 |
| 2019 | $13,019 | $149,060 | $36,383 | $112,677 |
| 2018 | $14,526 | $165,321 | $39,547 | $125,774 |
| 2017 | $14,338 | $161,462 | $38,624 | $122,838 |
| 2016 | $13,843 | $154,613 | $36,986 | $117,627 |
| 2015 | $13,574 | $144,593 | $34,589 | $110,004 |
| 2014 | $13,191 | $139,164 | $37,149 | $102,015 |
| 2012 | $12,768 | $139,442 | $37,223 | $102,219 |
Source: Public Records
Map
Nearby Homes
- 1012 Hobson Dr
- 15 Thompson Ct
- 913 Hobson Dr
- 938 Hidden Lake Dr
- 1113 Lockwood Dr
- 46 Copperwood Dr
- 1118 Larraway Dr
- 437 Caren Dr
- 720 Dunhill Dr
- 670 Dunhill Dr
- 625 Marseilles Cir
- 276 Stanton Dr
- 603 Cherbourg Ct N
- 538 Lasalle Ct
- 711 Woodhollow Ln
- 327 Lasalle Ln
- 620 Cobblestone Ln
- 931 Shady Grove Ln
- 1265 Devonshire Rd
- 1141 Devonshire Rd
- 1110 Hidden Lake Dr
- 1114 Hidden Lake Dr
- 1113 Old Barn Rd
- 1108 Hidden Lake Dr
- 1111 Old Barn Rd
- 1109 Old Barn Rd
- 1113 Hidden Lake Dr
- 1115 Hidden Lake Dr
- 1111 Hidden Lake Dr
- 1106 Hidden Lake Dr
- 1117 Hidden Lake Dr
- 1107 Old Barn Rd
- 1109 Hidden Lake Dr
- 1200 Hidden Lake Dr
- 101 Old Barn Ct
- 1104 Hidden Lake Dr
- 1107 Hidden Lake Dr
- 1105 Old Barn Rd
- 200 Jacobs Ct
- 214 Jacobs Ct