Estimated Value: $273,000 - $330,000
3
Beds
2
Baths
1,653
Sq Ft
$181/Sq Ft
Est. Value
About This Home
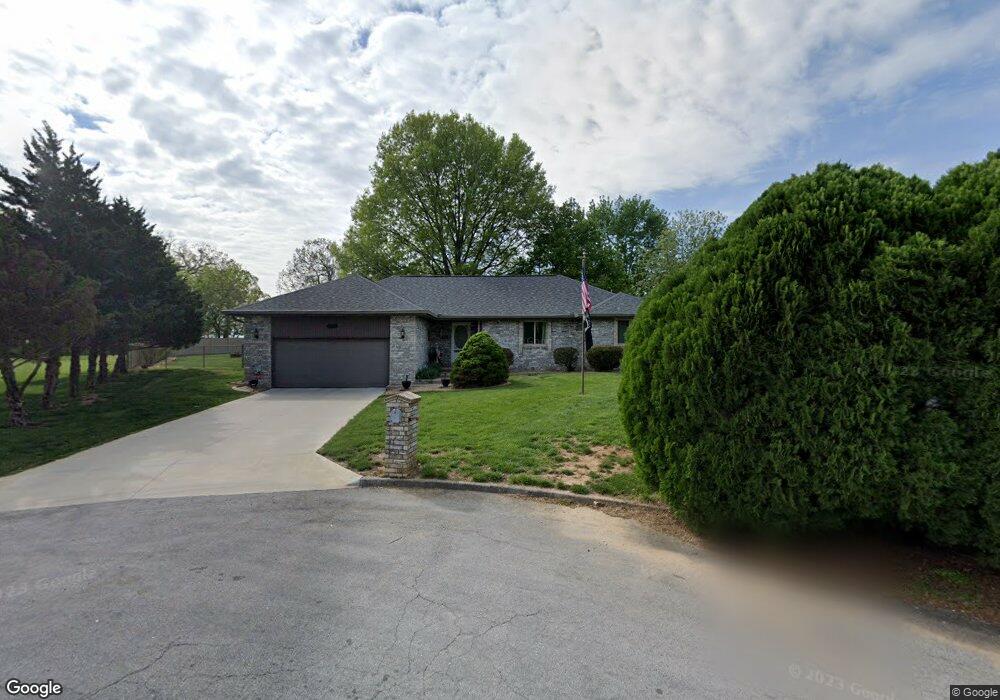
This home is located at 1112 Ichabod Ct, Nixa, MO 65714 and is currently estimated at $299,192, approximately $180 per square foot. 1112 Ichabod Ct is a home located in Christian County with nearby schools including Espy Elementary School, Nicholas A. Inman Intermediate School, and Nixa Junior High School.
Ownership History
Date
Name
Owned For
Owner Type
Purchase Details
Closed on
Jan 14, 2025
Sold by
Block Rodney R and Block Janell
Bought by
Rodney And Janell Block Revocable Living Trus
Current Estimated Value
Purchase Details
Closed on
Oct 15, 2009
Sold by
Kissire Timothy A and Kissire Wendy
Bought by
Block Rodney R and Block Janell
Home Financials for this Owner
Home Financials are based on the most recent Mortgage that was taken out on this home.
Original Mortgage
$45,000
Interest Rate
5.05%
Mortgage Type
New Conventional
Purchase Details
Closed on
Mar 23, 2007
Sold by
Jones Richard L and Jones Judith K
Bought by
Kissire Timothy A and Kissire Wendy
Home Financials for this Owner
Home Financials are based on the most recent Mortgage that was taken out on this home.
Original Mortgage
$146,900
Interest Rate
7.4%
Mortgage Type
Adjustable Rate Mortgage/ARM
Create a Home Valuation Report for This Property
The Home Valuation Report is an in-depth analysis detailing your home's value as well as a comparison with similar homes in the area
Home Values in the Area
Average Home Value in this Area
Purchase History
| Date | Buyer | Sale Price | Title Company |
|---|---|---|---|
| Rodney And Janell Block Revocable Living Trus | -- | None Listed On Document | |
| Block Rodney R | -- | None Available | |
| Kissire Timothy A | -- | None Available |
Source: Public Records
Mortgage History
| Date | Status | Borrower | Loan Amount |
|---|---|---|---|
| Previous Owner | Block Rodney R | $45,000 | |
| Previous Owner | Kissire Timothy A | $146,900 |
Source: Public Records
Tax History
| Year | Tax Paid | Tax Assessment Tax Assessment Total Assessment is a certain percentage of the fair market value that is determined by local assessors to be the total taxable value of land and additions on the property. | Land | Improvement |
|---|---|---|---|---|
| 2025 | $1,615 | $29,010 | -- | -- |
| 2024 | $1,615 | $27,210 | -- | -- |
| 2023 | $1,615 | $27,210 | -- | -- |
| 2022 | $1,526 | $25,690 | $0 | $0 |
| 2021 | $1,527 | $25,690 | $0 | $0 |
| 2020 | $1,458 | $23,450 | $0 | $0 |
| 2019 | $1,458 | $23,450 | $0 | $0 |
| 2018 | $1,167 | $20,250 | $0 | $0 |
| 2017 | $1,167 | $20,250 | $0 | $0 |
| 2016 | $1,148 | $20,250 | $0 | $0 |
| 2015 | $1,149 | $20,250 | $20,250 | $0 |
| 2014 | $1,114 | $20,140 | $0 | $0 |
| 2013 | $11 | $20,140 | $0 | $0 |
| 2011 | $11 | $40,280 | $0 | $0 |
Source: Public Records
Map
Nearby Homes
- 120 N Nicholas Rd
- 806 & 804 W Honeysuckle Ln
- 609 N Elderberry Ln
- 805 W Briarwood Ln
- 902 Foxwood Dr
- 1404 Cody Rd
- 711 Robinwood Ln
- 1343 W Tracker Rd
- 907 Northview Dr
- 1334 W Mount Vernon St
- 1209 W Mount Vernon St
- 1344 W Berkshire Ave
- 0 Missouri -- Unit 643 6915104
- 1353 Norfolk Ave
- 000 N Massey Blvd
- 911 Brooke Ct
- Lot #4 N Ginger Ln
- 000 (Tbd) Highway 160 (14 8 Acres) St
- 107 Northview Rd
- 207 W Park St
- 1112 Ichabod Ct
- 1108 Ichabod Ct
- 1118 Ichabod Ct
- 1113 Brom Bones Ct
- 1119 Brom Bones Ct
- 1113 Ichabod Ct
- 1121 Ichabod Ct
- 910 N Katrina Dr
- 1110 Brom Bones Ct
- 1127 Brom Bones Ct
- 1112 Brom Bones Ct
- 1106 W Crane Dr
- 1112 Brombones Ct
- 1114 W Crane Dr
- 1127 Ichabod Ct
- 1124 Brom Bones Ct
- 1128 W Crane Dr
- 1130 Brombones Ct
- 915 N Katrina Dr
- 875 Katrina Dr
Your Personal Tour Guide
Ask me questions while you tour the home.