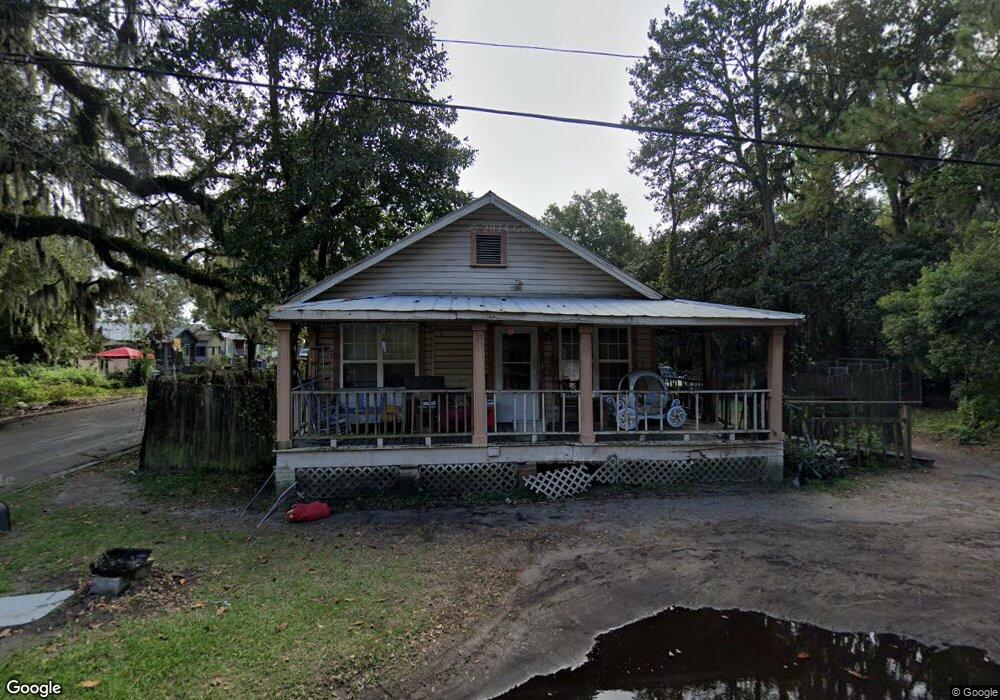
1112 M St Brunswick, GA 31520
New Town NeighborhoodEstimated Value: $67,624 - $95,000
3
Beds
1
Bath
1,000
Sq Ft
$79/Sq Ft
Est. Value
About This Home
This home is located at 1112 M St, Brunswick, GA 31520 and is currently estimated at $79,406, approximately $79 per square foot. 1112 M St is a home located in Glynn County with nearby schools including Burroughs-Molette Elementary School, Risley Middle School, and Glynn Academy.
Ownership History
Date
Name
Owned For
Owner Type
Purchase Details
Closed on
Aug 22, 2013
Sold by
Wrice Oren
Bought by
Wrice Oren and Wrice Brenta
Current Estimated Value
Purchase Details
Closed on
Feb 28, 2013
Sold by
Wrice Brenta L
Bought by
Wrice Oren and Wrice Brenta L
Purchase Details
Closed on
Apr 21, 2011
Sold by
Burton Improvements Llc
Bought by
Wrice Brenta L
Purchase Details
Closed on
Aug 28, 2009
Sold by
Jones Matthew
Bought by
Burton Improvements Llc
Purchase Details
Closed on
Jun 2, 2009
Sold by
Ameris Bank
Bought by
Ameris Bank
Purchase Details
Closed on
Nov 22, 2005
Sold by
Lotson Griffin
Bought by
Pierce Delores M K
Create a Home Valuation Report for This Property
The Home Valuation Report is an in-depth analysis detailing your home's value as well as a comparison with similar homes in the area
Home Values in the Area
Average Home Value in this Area
Purchase History
| Date | Buyer | Sale Price | Title Company |
|---|---|---|---|
| Wrice Oren | -- | -- | |
| Wrice Oren | -- | -- | |
| Wrice Brenta L | $15,000 | -- | |
| Burton Improvements Llc | $8,800 | -- | |
| Jones Matthew | $8,800 | -- | |
| Ameris Bank | -- | -- | |
| Pierce Delores M K | $24,000 | -- |
Source: Public Records
Tax History Compared to Growth
Tax History
| Year | Tax Paid | Tax Assessment Tax Assessment Total Assessment is a certain percentage of the fair market value that is determined by local assessors to be the total taxable value of land and additions on the property. | Land | Improvement |
|---|---|---|---|---|
| 2025 | $620 | $29,520 | $4,920 | $24,600 |
| 2024 | $363 | $17,280 | $2,960 | $14,320 |
| 2023 | $952 | $17,280 | $2,960 | $14,320 |
| 2022 | $902 | $15,840 | $2,960 | $12,880 |
| 2021 | $621 | $8,600 | $2,960 | $5,640 |
| 2020 | $674 | $10,000 | $2,960 | $7,040 |
| 2019 | $191 | $8,600 | $2,960 | $5,640 |
| 2018 | $234 | $9,720 | $2,960 | $6,760 |
| 2017 | $639 | $10,280 | $2,960 | $7,320 |
| 2016 | $554 | $10,280 | $2,960 | $7,320 |
| 2015 | $576 | $10,280 | $2,960 | $7,320 |
| 2014 | $576 | $10,280 | $2,960 | $7,320 |
Source: Public Records
Map
Nearby Homes