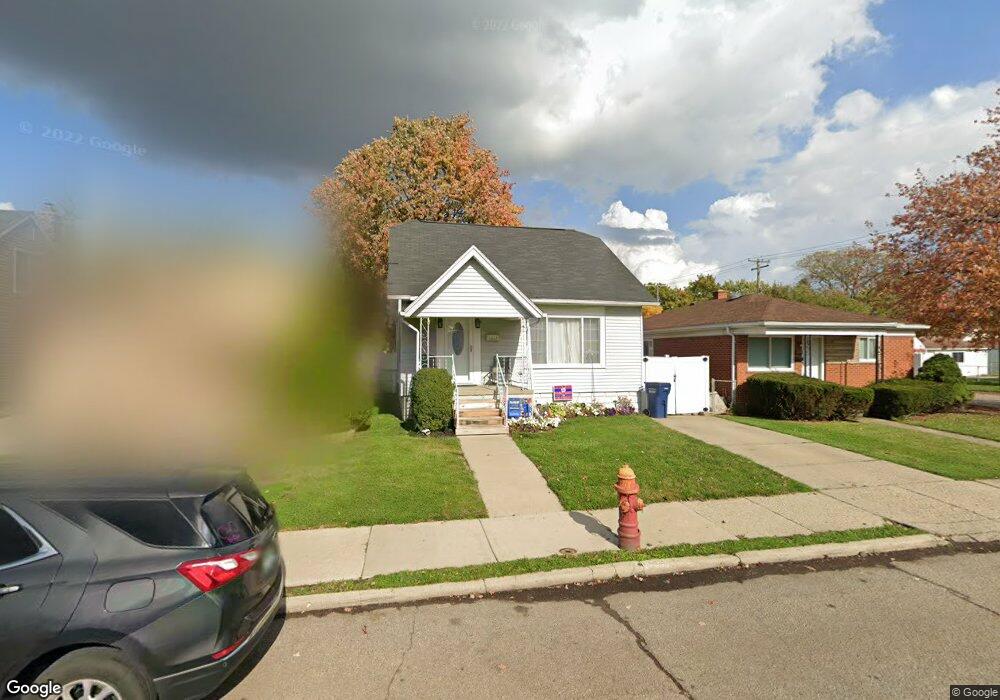
1112 Mill St Lincoln Park, MI 48146
Estimated Value: $144,000 - $167,000
--
Bed
1
Bath
1,070
Sq Ft
$150/Sq Ft
Est. Value
About This Home
This home is located at 1112 Mill St, Lincoln Park, MI 48146 and is currently estimated at $159,989, approximately $149 per square foot. 1112 Mill St is a home located in Wayne County with nearby schools including Keppen School, Lincoln Park Middle School, and Lincoln Park High School.
Ownership History
Date
Name
Owned For
Owner Type
Purchase Details
Closed on
Dec 7, 2021
Sold by
Burks Jason Paul
Bought by
Cavazos Matthew D
Current Estimated Value
Home Financials for this Owner
Home Financials are based on the most recent Mortgage that was taken out on this home.
Original Mortgage
$132,554
Outstanding Balance
$121,882
Interest Rate
3.09%
Mortgage Type
FHA
Estimated Equity
$38,107
Purchase Details
Closed on
Aug 16, 2012
Sold by
Burks Jason Paul and Burks Marsha R
Bought by
Burks Jason Paul
Home Financials for this Owner
Home Financials are based on the most recent Mortgage that was taken out on this home.
Original Mortgage
$108,961
Interest Rate
3.52%
Mortgage Type
VA
Purchase Details
Closed on
Dec 27, 2002
Sold by
Sitten Beth A
Bought by
Burks Jason Paul
Purchase Details
Closed on
Mar 25, 1999
Sold by
Myrand Mary M
Bought by
Sitten Beth A
Create a Home Valuation Report for This Property
The Home Valuation Report is an in-depth analysis detailing your home's value as well as a comparison with similar homes in the area
Home Values in the Area
Average Home Value in this Area
Purchase History
| Date | Buyer | Sale Price | Title Company |
|---|---|---|---|
| Cavazos Matthew D | $135,000 | Liberty Title | |
| Burks Jason Paul | -- | None Available | |
| Burks Jason Paul | $117,000 | Multiple | |
| Sitten Beth A | $84,000 | -- |
Source: Public Records
Mortgage History
| Date | Status | Borrower | Loan Amount |
|---|---|---|---|
| Open | Cavazos Matthew D | $132,554 | |
| Previous Owner | Burks Jason Paul | $108,961 |
Source: Public Records
Tax History Compared to Growth
Tax History
| Year | Tax Paid | Tax Assessment Tax Assessment Total Assessment is a certain percentage of the fair market value that is determined by local assessors to be the total taxable value of land and additions on the property. | Land | Improvement |
|---|---|---|---|---|
| 2025 | $2,296 | $72,100 | $0 | $0 |
| 2024 | $2,296 | $65,400 | $0 | $0 |
| 2023 | $2,177 | $59,200 | $0 | $0 |
| 2022 | $3,439 | $47,900 | $0 | $0 |
| 2021 | $1,823 | $37,700 | $0 | $0 |
| 2020 | $1,354 | $31,700 | $0 | $0 |
| 2019 | $1,070 | $27,300 | $0 | $0 |
| 2018 | $964 | $24,600 | $0 | $0 |
| 2017 | $721 | $22,900 | $0 | $0 |
| 2016 | $1,261 | $23,600 | $0 | $0 |
| 2015 | $2,320 | $23,200 | $0 | $0 |
| 2013 | $2,390 | $24,900 | $0 | $0 |
| 2012 | $1,473 | $25,700 | $5,100 | $20,600 |
Source: Public Records
Map
Nearby Homes
- 1115 Mill St
- 1125 Mill St
- 1208 Mill St
- 1184 Farnham Ave
- 2419 Chandler Ave
- 1215 Mill St
- 1194 Lincoln Ave
- 1042 Champaign Rd
- 1151 Progress Ave
- 1187 Park Ave
- 1027 Park Ave
- 5114 Hawthorn
- 878 Champaign Rd
- 881 Garfield Ave
- 1370 Garfield Ave
- 853 Mill St
- 1051 Capitol Ave
- 880 White Ave
- 817 Lincoln Ave
- 1424 Mayflower Ave