
Seller's Agent in 2020
Callie Hughey-Walker
Hughey & Neuman, Inc.
(229) 344-5261
3 in this area
278 Total Sales
Estimated Value: $186,678 - $228,000
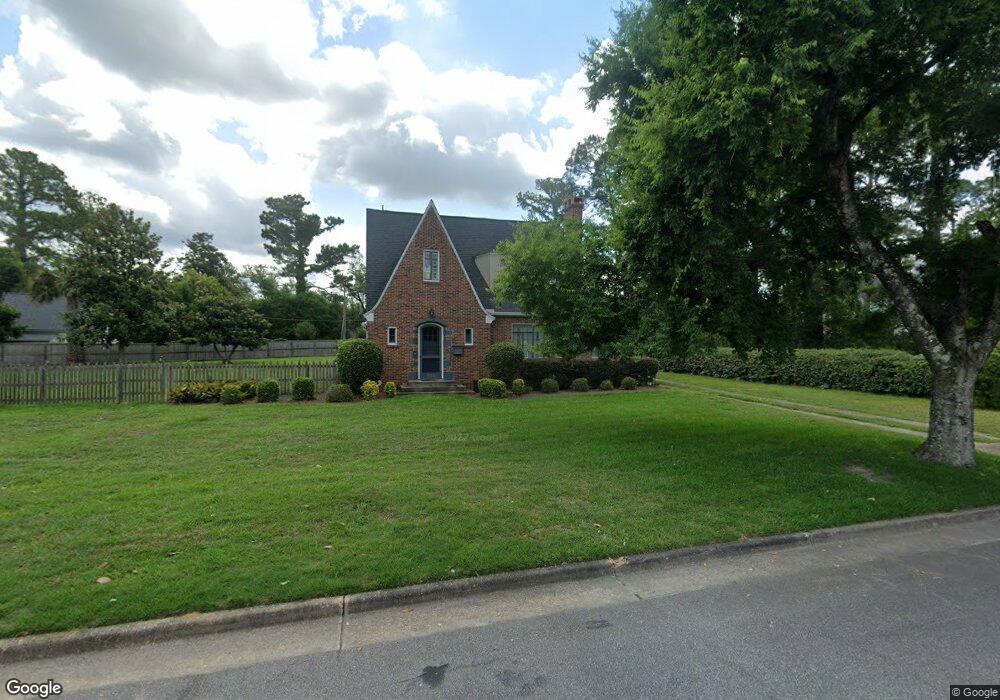
HISTORIC RAWSON CIRCLE HOME Full Of CHARM & CHARACTER! This perfectly maintained home will surely make you appreciate the architecture and charm of the 1930's. Located in the HEART of Rawson Circle, this home is move in ready with all the upgrades you could ever need! As you walk thru the front door, you are welcomed by the stately staircase with curled banister and gorgeous palladium window leading to the second level of the home. Stepping further into the foyer, your eye is immediately drawn to the focal point of the spacious living room- the gas burning fireplace with mantle! Lots of natural light fills the room and highlights the plaster walls, original picture molding and beautiful hardwood floors! Located off the Living Room is the Sun Room- certainly a space for entertaining and/or relaxation! The dining room is spacious with room for a large table! French doors from the dining room lead back into the Sunroom. The Kitchen is a chef's dream with granite countertops, center island with gas range, stainless appliances, eat- in area with banquet, updated lighting, decorative black and white tile flooring, pantry storage and additional built in storage with pine countertop! Other features downstairs that you will love is the half bath for guests and spacious laundry/mud room! Upstairs you will find 3 bedrooms with hardwood floors and full bath that features tub/shower combo and has been updated with subway tile and decorative bead board! Outside you will find a paneled pine garage apartment with full bath! Ample storage is available and single car garage. The property is completely fenced totaling 0.76 acres. This beautiful Tudor style home has been well loved and maintained is looking for the perfect person to call this their new HOME! Call today for more information.
| Date | Buyer | Sale Price | Title Company |
|---|---|---|---|
| Christensen David W | -- | -- | |
| Hobby Mary E | $165,000 | -- | |
| Rouse Hudson L | $147,000 | -- | |
| Rouse Kirk | $140,000 | -- | |
| Mcgrath Timothy Chad | -- | -- | |
| Bailey Alyssa K | $78,000 | -- | |
| Neill Neill F | -- | -- |
| Date | Status | Borrower | Loan Amount |
|---|---|---|---|
| Previous Owner | Hobby Mary E | $160,050 |
| Date | Event | Price | List to Sale | Price per Sq Ft | Prior Sale |
|---|---|---|---|---|---|
| 03/02/2020 03/02/20 | Sold | $160,000 | -- | $76 / Sq Ft | View Prior Sale |
| 01/20/2020 01/20/20 | Pending | -- | -- | -- |
| Year | Tax Paid | Tax Assessment Tax Assessment Total Assessment is a certain percentage of the fair market value that is determined by local assessors to be the total taxable value of land and additions on the property. | Land | Improvement |
|---|---|---|---|---|
| 2024 | -- | $45,520 | $8,840 | $36,680 |
| 2023 | $0 | $45,520 | $8,840 | $36,680 |
| 2022 | $1,973 | $45,520 | $8,840 | $36,680 |
| 2021 | $1,973 | $45,520 | $8,840 | $36,680 |
| 2020 | $1,891 | $45,520 | $8,840 | $36,680 |
| 2019 | $1,898 | $45,520 | $8,840 | $36,680 |
| 2018 | $1,906 | $45,520 | $8,840 | $36,680 |
| 2017 | $1,776 | $45,520 | $8,840 | $36,680 |
| 2016 | $1,777 | $45,520 | $8,840 | $36,680 |
| 2015 | $1,782 | $45,520 | $8,840 | $36,680 |
| 2014 | $1,829 | $47,240 | $10,560 | $36,680 |
Seller's Agent in 2020
Callie Hughey-Walker
Hughey & Neuman, Inc.
(229) 344-5261
3 in this area
278 Total Sales
C
Buyer's Agent in 2020
Christina Hawkins
Shiver And Williams Realty, LLC