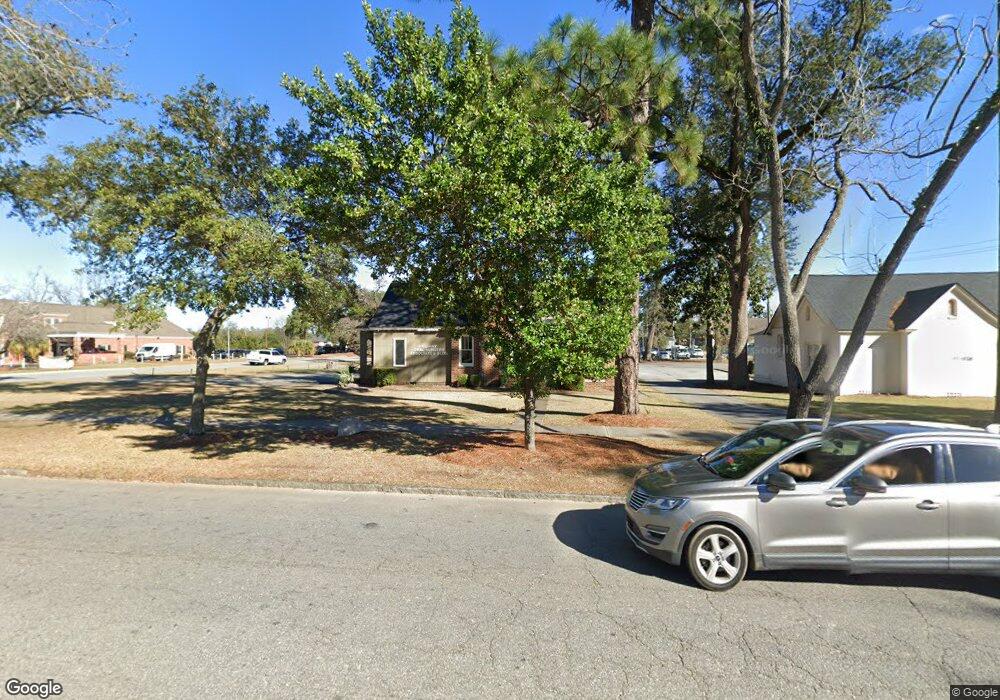
1112 N Jefferson St Albany, GA 31701
Albany Historic District NeighborhoodEstimated Value: $155,000 - $223,000
4
Beds
4
Baths
2,939
Sq Ft
$64/Sq Ft
Est. Value
About This Home
This home is located at 1112 N Jefferson St, Albany, GA 31701 and is currently estimated at $188,322, approximately $64 per square foot. 1112 N Jefferson St is a home located in Dougherty County with nearby schools including Northside Elementary School, Albany Middle School, and Albany High School.
Ownership History
Date
Name
Owned For
Owner Type
Purchase Details
Closed on
Nov 30, 2021
Sold by
Allen Marvin L
Bought by
Albany Symphony Association Inc
Current Estimated Value
Purchase Details
Closed on
Aug 18, 2007
Sold by
Myers Lamar J
Bought by
Allen Marvin L
Purchase Details
Closed on
Dec 21, 1997
Sold by
Myers Lamar J
Bought by
Allen Marvin L
Purchase Details
Closed on
Mar 23, 1976
Sold by
Allen Marvin Ljr
Bought by
Myers Lamar J
Create a Home Valuation Report for This Property
The Home Valuation Report is an in-depth analysis detailing your home's value as well as a comparison with similar homes in the area
Home Values in the Area
Average Home Value in this Area
Purchase History
| Date | Buyer | Sale Price | Title Company |
|---|---|---|---|
| Albany Symphony Association Inc | -- | -- | |
| Allen Marvin L | -- | -- | |
| Allen Marvin L | $97,500 | -- | |
| Myers Lamar J | -- | -- |
Source: Public Records
Tax History Compared to Growth
Tax History
| Year | Tax Paid | Tax Assessment Tax Assessment Total Assessment is a certain percentage of the fair market value that is determined by local assessors to be the total taxable value of land and additions on the property. | Land | Improvement |
|---|---|---|---|---|
| 2024 | -- | $46,012 | $9,080 | $36,932 |
| 2023 | $0 | $46,012 | $9,080 | $36,932 |
| 2022 | $1,995 | $46,012 | $9,080 | $36,932 |
| 2021 | $1,995 | $46,012 | $9,080 | $36,932 |
| 2020 | $2,000 | $46,012 | $9,080 | $36,932 |
| 2019 | $2,007 | $46,012 | $9,080 | $36,932 |
| 2018 | $2,016 | $46,012 | $9,080 | $36,932 |
| 2017 | $1,878 | $46,012 | $9,080 | $36,932 |
| 2016 | $1,879 | $46,012 | $9,080 | $36,932 |
| 2015 | $1,884 | $46,012 | $9,080 | $36,932 |
| 2014 | $2,043 | $50,532 | $13,600 | $36,932 |
Source: Public Records
Map
Nearby Homes
- 305 6th Ave
- 303 6th Ave
- 910 N Jackson St
- 804 N Jefferson St
- 1207 N Madison St
- 526 10th Ave
- 610 W 2nd Ave
- 1107 N Davis St
- 631 W 3rd Ave
- 903 N Davis St
- 507 N Jackson St
- 711 W 2nd Ave
- 634 11th Ave
- 707 8th Ave
- 703 9th Ave
- 800 7th Ave
- 717 8th Ave
- 714 9th Ave
- 1640 Arlington Park Cir
- 1648 Arlington Park Cir