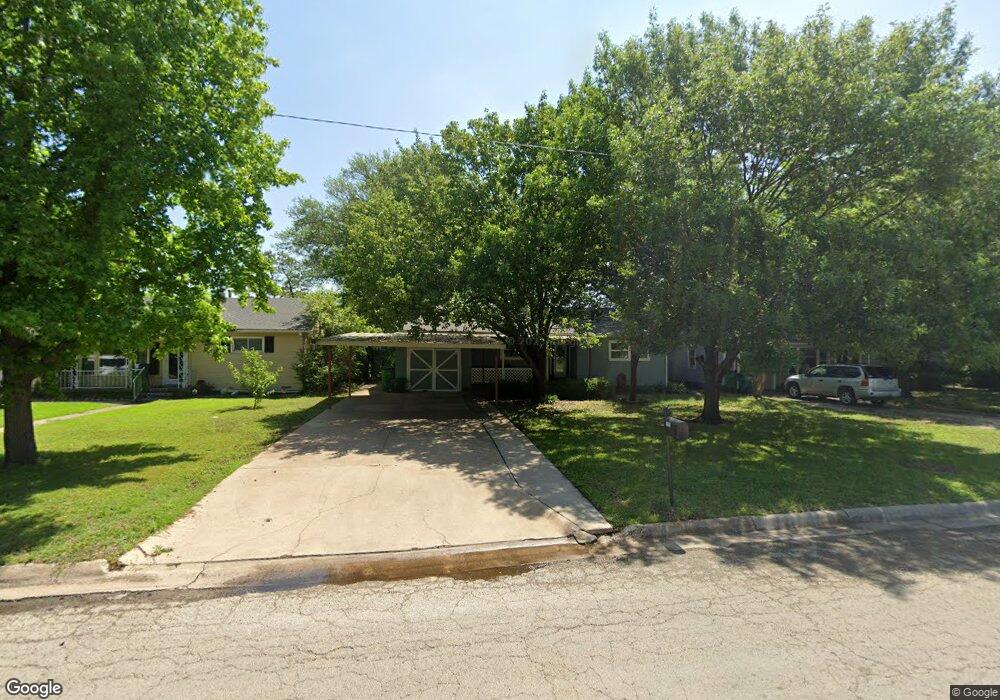
1112 N Morris St Gainesville, TX 76240
Estimated Value: $200,000 - $243,000
3
Beds
2
Baths
1,557
Sq Ft
$142/Sq Ft
Est. Value
About This Home
This home is located at 1112 N Morris St, Gainesville, TX 76240 and is currently estimated at $221,417, approximately $142 per square foot. 1112 N Morris St is a home located in Cooke County with nearby schools including Edison Elementary School, W.E. Chalmers Elementary School, and Gainesville Intermediate School.
Ownership History
Date
Name
Owned For
Owner Type
Purchase Details
Closed on
Aug 8, 2023
Sold by
Sicking Josh and Sicking Nicole
Bought by
5 Am Properties Llc
Current Estimated Value
Purchase Details
Closed on
Sep 8, 2006
Sold by
Shinpaugh Edward
Bought by
Shinapaugh Glenda Sue
Home Financials for this Owner
Home Financials are based on the most recent Mortgage that was taken out on this home.
Original Mortgage
$5,000
Interest Rate
6.55%
Mortgage Type
Purchase Money Mortgage
Create a Home Valuation Report for This Property
The Home Valuation Report is an in-depth analysis detailing your home's value as well as a comparison with similar homes in the area
Home Values in the Area
Average Home Value in this Area
Purchase History
| Date | Buyer | Sale Price | Title Company |
|---|---|---|---|
| 5 Am Properties Llc | -- | None Listed On Document | |
| Shinapaugh Glenda Sue | -- | -- |
Source: Public Records
Mortgage History
| Date | Status | Borrower | Loan Amount |
|---|---|---|---|
| Previous Owner | Shinapaugh Glenda Sue | $5,000 |
Source: Public Records
Tax History Compared to Growth
Tax History
| Year | Tax Paid | Tax Assessment Tax Assessment Total Assessment is a certain percentage of the fair market value that is determined by local assessors to be the total taxable value of land and additions on the property. | Land | Improvement |
|---|---|---|---|---|
| 2025 | $3,334 | $173,251 | $36,410 | $136,841 |
| 2024 | $3,334 | $175,933 | $36,410 | $139,523 |
| 2023 | $2,684 | $136,819 | $33,100 | $103,719 |
| 2022 | $2,891 | $132,774 | $29,522 | $103,252 |
| 2021 | $2,786 | $108,197 | $19,681 | $88,516 |
| 2020 | $2,191 | $98,226 | $18,787 | $79,439 |
| 2019 | $2,050 | $75,000 | $14,173 | $60,827 |
| 2018 | $2,256 | $82,670 | $9,393 | $73,277 |
| 2017 | $2,155 | $79,253 | $9,393 | $69,860 |
| 2015 | $1,778 | $74,341 | $9,393 | $64,948 |
| 2014 | $1,778 | $74,020 | $9,393 | $64,627 |
Source: Public Records
Map
Nearby Homes
- TBD County Road 208
- 764
- 802 Myrtle St
- 901 N Morris St
- 1306 N Clements St
- 1305 Hillcrest Blvd
- 811 Ritchey St
- 1016 N Howeth St
- 805 Ritchey St
- Lot #2 Belcher St
- Lot #1 Belcher St
- Lot #3 Belcher St
- 1113 Fair Ave
- 1520 Olive St
- 1102 Fair Ave
- 608 Ritchey St
- 625 Denison St
- 605 N Schopmeyer St
- 603 N Schopmeyer St
- 705 Fair Ave
- 1110 N Morris St
- 1114 N Morris St
- 1108 N Morris St
- 1106 N Morris St
- 83 Courtney Ln Unit 123
- 1200 N Morris St
- 1111 N Morris St
- 1113 N Morris St
- 1109 N Morris St
- 1107 N Morris St
- 1202 N Morris St
- 1102 N Morris St
- 1105 N Morris St
- 1201 N Morris St
- 1203 N Morris St
- 1204 N Morris St
- 1207 N Grand Ave
- 1103 N Morris St
- 1100 N Morris St
- 1004 E Star St