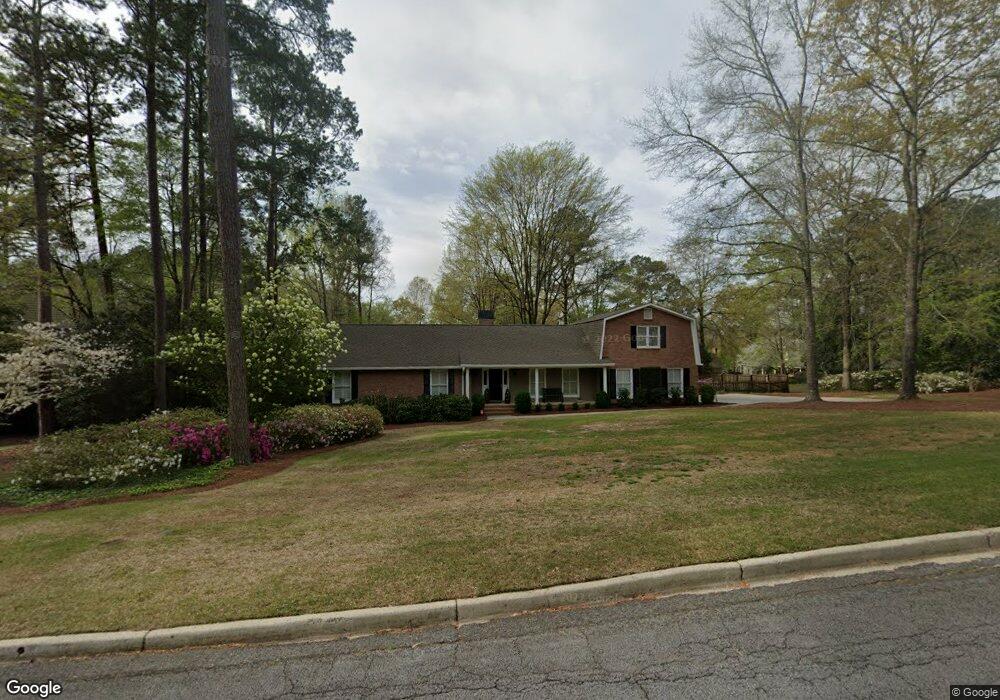
1112 Saint Andrews Dr Macon, GA 31210
Estimated Value: $513,000 - $626,000
4
Beds
3
Baths
3,292
Sq Ft
$170/Sq Ft
Est. Value
About This Home
This home is located at 1112 Saint Andrews Dr, Macon, GA 31210 and is currently estimated at $560,456, approximately $170 per square foot. 1112 Saint Andrews Dr is a home located in Bibb County with nearby schools including Carter Elementary School, Howard Middle School, and Howard High School.
Ownership History
Date
Name
Owned For
Owner Type
Purchase Details
Closed on
Apr 22, 2019
Sold by
Peterson Thomas L
Bought by
Sanders Walter Harrison and Sanders Dorothy Newman
Current Estimated Value
Home Financials for this Owner
Home Financials are based on the most recent Mortgage that was taken out on this home.
Original Mortgage
$252,000
Outstanding Balance
$221,551
Interest Rate
4.4%
Mortgage Type
New Conventional
Estimated Equity
$338,905
Purchase Details
Closed on
Aug 3, 2012
Sold by
Pearson Joseph S and Pearson Molly M
Bought by
Peterson Thomas L
Home Financials for this Owner
Home Financials are based on the most recent Mortgage that was taken out on this home.
Original Mortgage
$261,182
Interest Rate
3.65%
Mortgage Type
FHA
Purchase Details
Closed on
Aug 26, 2004
Bought by
Pearson Joseph and Pearson Molly M
Purchase Details
Closed on
Nov 13, 2003
Create a Home Valuation Report for This Property
The Home Valuation Report is an in-depth analysis detailing your home's value as well as a comparison with similar homes in the area
Home Values in the Area
Average Home Value in this Area
Purchase History
| Date | Buyer | Sale Price | Title Company |
|---|---|---|---|
| Sanders Walter Harrison | $31,500 | None Available | |
| Peterson Thomas L | $266,000 | None Available | |
| Pearson Joseph | $233,500 | -- | |
| -- | -- | -- |
Source: Public Records
Mortgage History
| Date | Status | Borrower | Loan Amount |
|---|---|---|---|
| Open | Sanders Walter Harrison | $252,000 | |
| Previous Owner | Peterson Thomas L | $261,182 |
Source: Public Records
Tax History Compared to Growth
Tax History
| Year | Tax Paid | Tax Assessment Tax Assessment Total Assessment is a certain percentage of the fair market value that is determined by local assessors to be the total taxable value of land and additions on the property. | Land | Improvement |
|---|---|---|---|---|
| 2025 | $4,317 | $182,662 | $48,960 | $133,702 |
| 2024 | $4,461 | $182,662 | $48,960 | $133,702 |
| 2023 | $3,698 | $170,596 | $48,960 | $121,636 |
| 2022 | $4,956 | $150,164 | $28,800 | $121,364 |
| 2021 | $5,133 | $142,086 | $28,800 | $113,286 |
| 2020 | $4,620 | $131,632 | $24,000 | $107,632 |
| 2019 | $4,418 | $112,852 | $24,000 | $88,852 |
| 2018 | $6,526 | $112,852 | $24,000 | $88,852 |
| 2017 | $3,966 | $112,852 | $24,000 | $88,852 |
| 2016 | $3,662 | $112,852 | $24,000 | $88,852 |
| 2015 | $5,184 | $112,852 | $24,000 | $88,852 |
| 2014 | $5,192 | $112,852 | $24,000 | $88,852 |
Source: Public Records
Map
Nearby Homes
- 1112 St Andrews Dr
- 1106 Saint Andrews Dr
- 103 Troon Way
- 0 Saint Andrews Dr Unit 8094183
- 0 Saint Andrews Dr Unit 8094180
- 0 Saint Andrews Dr Unit 8716811
- 0 Saint Andrews Dr Unit 7225346
- 0 Saint Andrews Dr Unit 7162830
- 0 Saint Andrews Dr
- 1120 Saint Andrews Dr
- 1111 Saint Andrews Dr
- 102 Troon Way
- 1115 Saint Andrews Dr
- 1098 Saint Andrews Dr
- 104 Troon Way
- 1123 Saint Andrews Dr
- 4792 Brae Burn Ln
- 107 Troon Way
- 1124 Saint Andrews Dr
- 193 Gleneagles Cir