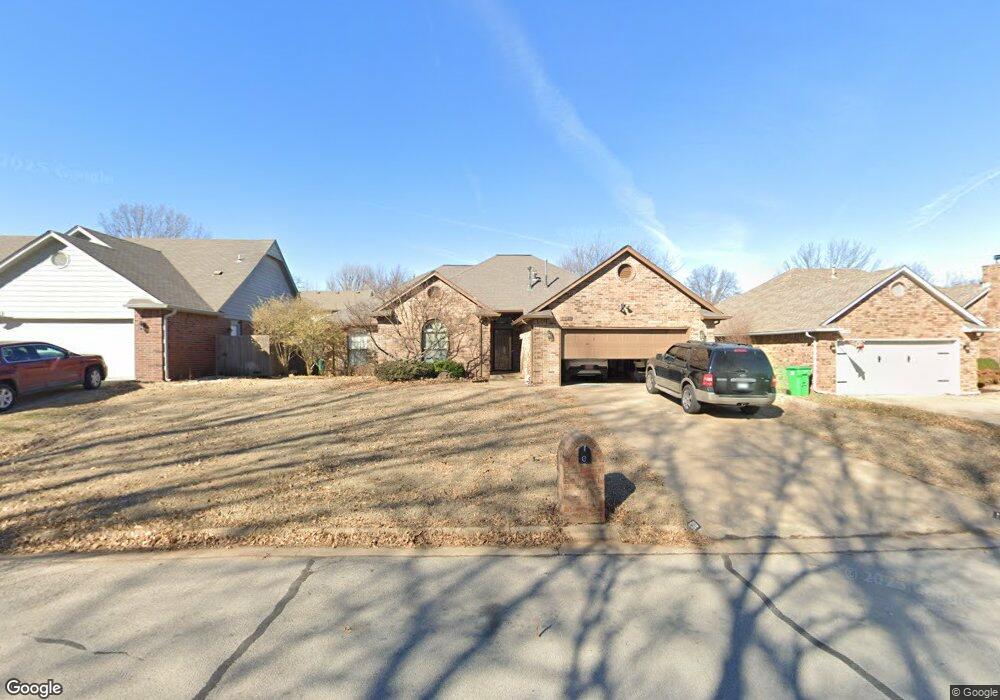
11120 S 107th East Ave Bixby, OK 74008
North Bixby NeighborhoodEstimated Value: $276,000 - $282,650
3
Beds
2
Baths
1,919
Sq Ft
$145/Sq Ft
Est. Value
About This Home
This home is located at 11120 S 107th East Ave, Bixby, OK 74008 and is currently estimated at $278,913, approximately $145 per square foot. 11120 S 107th East Ave is a home located in Tulsa County with nearby schools including Bixby East Elementary, Bixby Middle School, and Bixby High School.
Ownership History
Date
Name
Owned For
Owner Type
Purchase Details
Closed on
Mar 14, 2024
Sold by
Magee Brian P
Bought by
Pfriem Heather
Current Estimated Value
Purchase Details
Closed on
Mar 13, 2024
Sold by
Magee Michael K and Magee Cynthia A
Bought by
Pfriem Heather
Purchase Details
Closed on
Dec 28, 2011
Sold by
Willis Kevin Matthew and Willis Jennifer D
Bought by
Magee Sandra S
Purchase Details
Closed on
Jan 15, 2003
Sold by
Davis Colby L and Davis Ashlea A
Bought by
Willis Kevin Matthew and Willis Jennifer D
Home Financials for this Owner
Home Financials are based on the most recent Mortgage that was taken out on this home.
Original Mortgage
$129,200
Interest Rate
6.16%
Purchase Details
Closed on
May 26, 1998
Sold by
Davis Colby L and Davis Ashlea A
Bought by
Davis Colby L and Davis Ashlea A
Purchase Details
Closed on
Mar 16, 1998
Sold by
Hunt Randall D and Hunt Melissa L
Bought by
Davis Colby L and Welsh Ashlea A
Purchase Details
Closed on
Jan 1, 1994
Create a Home Valuation Report for This Property
The Home Valuation Report is an in-depth analysis detailing your home's value as well as a comparison with similar homes in the area
Home Values in the Area
Average Home Value in this Area
Purchase History
| Date | Buyer | Sale Price | Title Company |
|---|---|---|---|
| Pfriem Heather | -- | None Listed On Document | |
| Pfriem Heather | -- | None Listed On Document | |
| Magee Sandra S | $143,500 | None Available | |
| Willis Kevin Matthew | $127,000 | -- | |
| Davis Colby L | -- | Delta Title & Escrow Company | |
| Davis Colby L | $102,000 | Delta Title & Escrow Company | |
| -- | $89,000 | -- |
Source: Public Records
Mortgage History
| Date | Status | Borrower | Loan Amount |
|---|---|---|---|
| Previous Owner | Willis Kevin Matthew | $129,200 |
Source: Public Records
Tax History Compared to Growth
Tax History
| Year | Tax Paid | Tax Assessment Tax Assessment Total Assessment is a certain percentage of the fair market value that is determined by local assessors to be the total taxable value of land and additions on the property. | Land | Improvement |
|---|---|---|---|---|
| 2024 | $2,686 | $19,809 | $1,903 | $17,906 |
| 2023 | $2,686 | $20,203 | $2,067 | $18,136 |
| 2022 | $2,615 | $18,614 | $2,345 | $16,269 |
| 2021 | $2,370 | $18,043 | $2,273 | $15,770 |
| 2020 | $2,311 | $17,489 | $2,495 | $14,994 |
| 2019 | $2,295 | $17,299 | $2,468 | $14,831 |
| 2018 | $2,204 | $16,766 | $2,392 | $14,374 |
| 2017 | $2,122 | $17,249 | $2,461 | $14,788 |
| 2016 | $2,031 | $16,746 | $2,567 | $14,179 |
| 2015 | $1,883 | $17,206 | $2,638 | $14,568 |
| 2014 | $1,821 | $15,785 | $2,420 | $13,365 |
Source: Public Records
Map
Nearby Homes
- 11318 S 108th East Place
- 10607 E 115th St S
- 10306 E 114th Place S
- 4416 S Orange Ave
- 5905 W Charleston St
- 4529 S Retana Ave
- 4409 S Quinoa Ave
- 5716 W Austin St
- 4607 S Retana Place
- 4309 S Mimosa Ave
- 4401 S Quinoa Ave
- 4618 S Retana Place
- 11620 S 104th East Ave
- 4301 S Mimosa Ave
- 4708 S Sequoia Ave
- 11631 S 103rd East Ave
- 5817 W Vicksburg St
- 4520 S Dogwood Ave
- 4516 S Dogwood Ave
- 6310 W Durham Place
- 11202 S 107th East Ave
- 11116 S 107th East Ave
- 11202 S 107th Ave E
- 11121 S 106th Ave E
- 11121 S 106th East Ave
- 11201 S 106th East Ave
- 11117 S 106th East Ave
- 11206 S 107th East Ave
- 0 E 111th Place S Unit 1631278
- 3244 E 169th St S
- 3244 E 169th St S
- 3259 E 169th St S
- 3227 E 169th St S
- 3276 E 169th St S
- 3212 E 169th St S
- 3228 E 169th St S
- 3243 E 169th St S
- 11121 S 107th East Ave
- 11205 S 106th East Ave
- 11201 S 107th East Ave