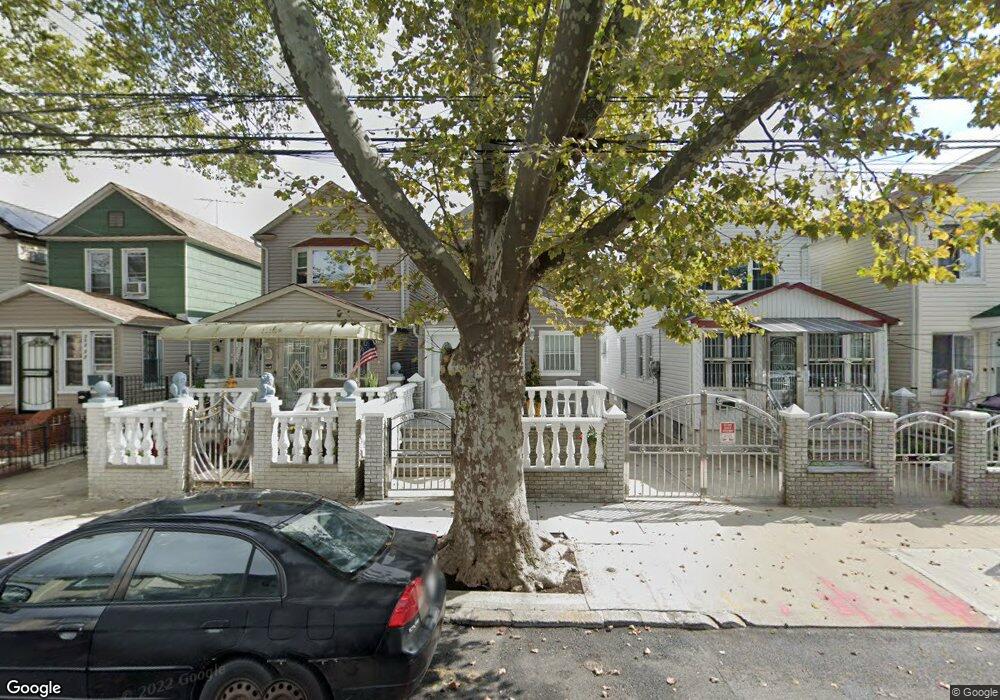
11121 113th St South Ozone Park, NY 11420
South Ozone Park NeighborhoodEstimated Value: $628,142 - $835,000
--
Bed
--
Bath
904
Sq Ft
$804/Sq Ft
Est. Value
About This Home
This home is located at 11121 113th St, South Ozone Park, NY 11420 and is currently estimated at $726,786, approximately $803 per square foot. 11121 113th St is a home located in Queens County with nearby schools including P.S. 108 - Capt. Vincent G. Fowler, M.S.137 America's School of Heroes, and John Adams High School.
Ownership History
Date
Name
Owned For
Owner Type
Purchase Details
Closed on
Aug 18, 2020
Sold by
Alves Christina A and Manbodh Govindra
Bought by
Alves Christina A and Alves Meshana S
Current Estimated Value
Purchase Details
Closed on
Sep 7, 2005
Sold by
May John M
Bought by
Alves Christina A and Manbodh Govindra
Purchase Details
Closed on
Jan 22, 2004
Sold by
Parabdin Rajesh and Singh Dhiraj
Bought by
May John M
Home Financials for this Owner
Home Financials are based on the most recent Mortgage that was taken out on this home.
Original Mortgage
$342,380
Interest Rate
5.8%
Mortgage Type
Purchase Money Mortgage
Purchase Details
Closed on
Oct 28, 1999
Sold by
Better Homes Depot Inc
Bought by
Parabdin Rajesh and Singh Dhiraj
Home Financials for this Owner
Home Financials are based on the most recent Mortgage that was taken out on this home.
Original Mortgage
$248,873
Interest Rate
7.86%
Mortgage Type
FHA
Purchase Details
Closed on
Aug 18, 1999
Sold by
Sacristan Pedro and Sacristan Pilar
Bought by
Better Homes Depot Inc
Create a Home Valuation Report for This Property
The Home Valuation Report is an in-depth analysis detailing your home's value as well as a comparison with similar homes in the area
Home Values in the Area
Average Home Value in this Area
Purchase History
| Date | Buyer | Sale Price | Title Company |
|---|---|---|---|
| Alves Christina A | -- | -- | |
| Alves Christina A | -- | -- | |
| Alves Christina A | -- | -- | |
| Alves Christina A | -- | -- | |
| May John M | $360,400 | -- | |
| May John M | $360,400 | -- | |
| Parabdin Rajesh | $249,000 | -- | |
| Parabdin Rajesh | $249,000 | -- | |
| Better Homes Depot Inc | $121,000 | -- | |
| Better Homes Depot Inc | $121,000 | -- |
Source: Public Records
Mortgage History
| Date | Status | Borrower | Loan Amount |
|---|---|---|---|
| Previous Owner | May John M | $342,380 | |
| Previous Owner | Parabdin Rajesh | $248,873 |
Source: Public Records
Tax History Compared to Growth
Tax History
| Year | Tax Paid | Tax Assessment Tax Assessment Total Assessment is a certain percentage of the fair market value that is determined by local assessors to be the total taxable value of land and additions on the property. | Land | Improvement |
|---|---|---|---|---|
| 2025 | $5,159 | $28,663 | $7,419 | $21,244 |
| 2024 | $5,171 | $27,086 | $7,493 | $19,593 |
| 2023 | $4,900 | $25,795 | $7,910 | $17,885 |
| 2022 | $4,605 | $26,460 | $9,660 | $16,800 |
| 2021 | $4,861 | $25,680 | $9,660 | $16,020 |
| 2020 | $4,760 | $28,200 | $9,660 | $18,540 |
| 2019 | $4,429 | $26,100 | $9,660 | $16,440 |
| 2018 | $4,084 | $21,496 | $9,613 | $11,883 |
| 2017 | $3,863 | $20,420 | $9,585 | $10,835 |
| 2016 | $3,772 | $20,420 | $9,585 | $10,835 |
| 2015 | $2,104 | $19,905 | $9,925 | $9,980 |
| 2014 | $2,104 | $18,810 | $9,174 | $9,636 |
Source: Public Records
Map
Nearby Homes
- 11120 112th St
- 11140 114th St
- 111-38 114th St
- 111-40 114th St
- 112-05 Rockaway Blvd
- 111-03 Rockaway Blvd
- 109-46 115th St
- 11501 Linden Blvd
- 111-32 116th St
- 10921 114th St
- 11401 115th St
- 115-17 Linden Blvd
- 109-17 111th St
- 10920 116th St
- 113-07 109th Ave
- 11115 117th St
- 115-35 114th Place
- 107-55 111th St
- 115-03 115th St
- 114-02 Sutter Ave
- 11123 113th St
- 11119 113th St
- 11117 113th St
- 11125 113th St
- 111-25 113th St
- 111-17 113th St
- 11115 113th St
- 11127 113th St
- 11113 113th St
- 11129 113th St
- 11134 114th St
- 11132 114th St
- 11136 114th St
- 11130 114th St
- 11111 113th St
- 11111 113th St
- 11138 114th St
- 11128 114th St
- 11141 113th St
- 11132 114th St