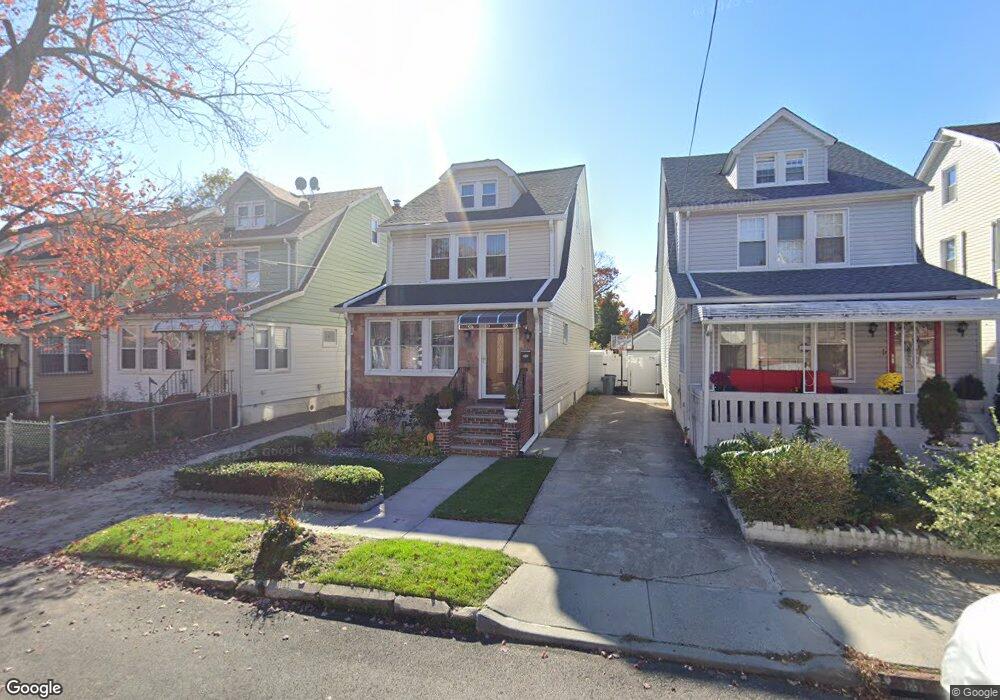
11124 178th St Jamaica, NY 11433
Saint Albans NeighborhoodEstimated Value: $648,000 - $832,000
3
Beds
2
Baths
1,760
Sq Ft
$418/Sq Ft
Est. Value
About This Home
This home is located at 11124 178th St, Jamaica, NY 11433 and is currently estimated at $735,760, approximately $418 per square foot. 11124 178th St is a home located in Queens County with nearby schools including Ps 36 St Albans School, Is 59 Springfield Gardens, and Allen Christian School.
Ownership History
Date
Name
Owned For
Owner Type
Purchase Details
Closed on
Jun 22, 2021
Sold by
Brathwaite Richard and Thomas Juliana
Bought by
Brathwaite Rasheda and Brathwaite Richard
Current Estimated Value
Home Financials for this Owner
Home Financials are based on the most recent Mortgage that was taken out on this home.
Original Mortgage
$247
Outstanding Balance
$223
Interest Rate
2.8%
Mortgage Type
Purchase Money Mortgage
Estimated Equity
$735,537
Purchase Details
Closed on
Aug 22, 2017
Sold by
Arvest Central Mortgage Company and Central Mortgage Company
Bought by
Brathwaite Richard and Thomas Juliana
Home Financials for this Owner
Home Financials are based on the most recent Mortgage that was taken out on this home.
Original Mortgage
$413,250
Outstanding Balance
$343,718
Interest Rate
3.93%
Mortgage Type
New Conventional
Estimated Equity
$392,042
Purchase Details
Closed on
Jun 15, 2012
Sold by
Chiariello Esq - Referee Dominic
Bought by
Central Mortgage Company
Purchase Details
Closed on
Sep 29, 2006
Sold by
Bdlak Equities Inc
Bought by
Comrie Kurt and Graham Dianne
Home Financials for this Owner
Home Financials are based on the most recent Mortgage that was taken out on this home.
Original Mortgage
$107,400
Interest Rate
6.47%
Purchase Details
Closed on
Sep 13, 2006
Sold by
Barker Franklin S and Nieves David R
Bought by
Bdlak Equities Inc
Home Financials for this Owner
Home Financials are based on the most recent Mortgage that was taken out on this home.
Original Mortgage
$107,400
Interest Rate
6.47%
Purchase Details
Closed on
Jun 1, 2001
Sold by
Exodus I Inc
Bought by
Barker Franklin S and Nieves David R
Home Financials for this Owner
Home Financials are based on the most recent Mortgage that was taken out on this home.
Original Mortgage
$238,750
Interest Rate
7.14%
Mortgage Type
Purchase Money Mortgage
Purchase Details
Closed on
Apr 16, 2001
Sold by
Lankford Barry and Lankford Fannie Anita
Bought by
Exodus 1 Inc
Home Financials for this Owner
Home Financials are based on the most recent Mortgage that was taken out on this home.
Original Mortgage
$238,750
Interest Rate
7.14%
Mortgage Type
Purchase Money Mortgage
Purchase Details
Closed on
Nov 27, 2000
Sold by
Lankford Barry
Bought by
Exodus Development Corp
Home Financials for this Owner
Home Financials are based on the most recent Mortgage that was taken out on this home.
Original Mortgage
$139,000
Interest Rate
7.78%
Mortgage Type
Seller Take Back
Create a Home Valuation Report for This Property
The Home Valuation Report is an in-depth analysis detailing your home's value as well as a comparison with similar homes in the area
Home Values in the Area
Average Home Value in this Area
Purchase History
| Date | Buyer | Sale Price | Title Company |
|---|---|---|---|
| Brathwaite Rasheda | -- | -- | |
| Brathwaite Rasheda | -- | -- | |
| Brathwaite Richard | $441,090 | -- | |
| Brathwaite Richard | $441,090 | -- | |
| Central Mortgage Company | $306,428 | -- | |
| Central Mortgage Company | $306,428 | -- | |
| Comrie Kurt | $537,000 | -- | |
| Comrie Kurt | $537,000 | -- | |
| Bdlak Equities Inc | $300,000 | -- | |
| Bdlak Equities Inc | $300,000 | -- | |
| Barker Franklin S | -- | -- | |
| Barker Franklin S | -- | -- | |
| Exodus 1 Inc | -- | -- | |
| Exodus 1 Inc | -- | -- | |
| Exodus Development Corp | $140,000 | First American Title Ins Co | |
| Exodus Development Corp | $140,000 | First American Title Ins Co |
Source: Public Records
Mortgage History
| Date | Status | Borrower | Loan Amount |
|---|---|---|---|
| Open | Brathwaite Rasheda | $247 | |
| Closed | Brathwaite Rasheda | $247 | |
| Open | Brathwaite Richard | $413,250 | |
| Closed | Brathwaite Richard | $413,250 | |
| Previous Owner | Comrie Kurt | $107,400 | |
| Previous Owner | Comrie Kurt | $429,600 | |
| Previous Owner | Barker Franklin S | $238,750 | |
| Previous Owner | Exodus Development Corp | $139,000 |
Source: Public Records
Tax History Compared to Growth
Tax History
| Year | Tax Paid | Tax Assessment Tax Assessment Total Assessment is a certain percentage of the fair market value that is determined by local assessors to be the total taxable value of land and additions on the property. | Land | Improvement |
|---|---|---|---|---|
| 2025 | $5,353 | $29,722 | $8,989 | $20,733 |
| 2024 | $5,353 | $28,040 | $8,553 | $19,487 |
| 2023 | $5,050 | $26,455 | $7,237 | $19,218 |
| 2022 | $4,736 | $38,760 | $12,720 | $26,040 |
| 2021 | $5,253 | $37,920 | $12,720 | $25,200 |
| 2020 | $5,243 | $33,900 | $12,720 | $21,180 |
| 2019 | $4,888 | $33,300 | $12,720 | $20,580 |
| 2018 | $4,494 | $22,046 | $9,404 | $12,642 |
| 2017 | $4,240 | $20,800 | $8,926 | $11,874 |
| 2016 | $4,158 | $20,800 | $8,926 | $11,874 |
| 2015 | $2,367 | $20,641 | $11,682 | $8,959 |
| 2014 | $2,367 | $19,473 | $11,906 | $7,567 |
Source: Public Records
Map
Nearby Homes
- 17718 Sayres Ave
- 17709 112th Ave
- 177-08 Sayres Ave
- 111-54 178th Place
- 112-13 178th St
- 112- 2 178th St
- 112-26 176th St
- 110-40 176th St
- 112-45 178th St
- 11245 178th St
- 11176 180th St
- 10944 177th St
- 109-49 176th St
- 110-01 175th St
- 179-07 Murdock Ave
- 17210 111th Ave
- 10912 176th St
- 17209 Sayres Ave
- 172-18 111th Ave
- 11023 172nd St
- 11124 178th St
- 111-28 178th St
- 11122 178th St
- 11128 178th St
- 11118 178th St
- 11118 178th St
- 11130 178th St
- 11116 178th St
- 11134 178th St
- 11121 177th St
- 111-25 177th St
- 11123 178th St
- 11129 177th St
- 11112 178th St
- 11112 178th St
- 11125 178th St
- 11136 178th St
- 11119 178th St
- 11119 177th St
- 11135 177th St