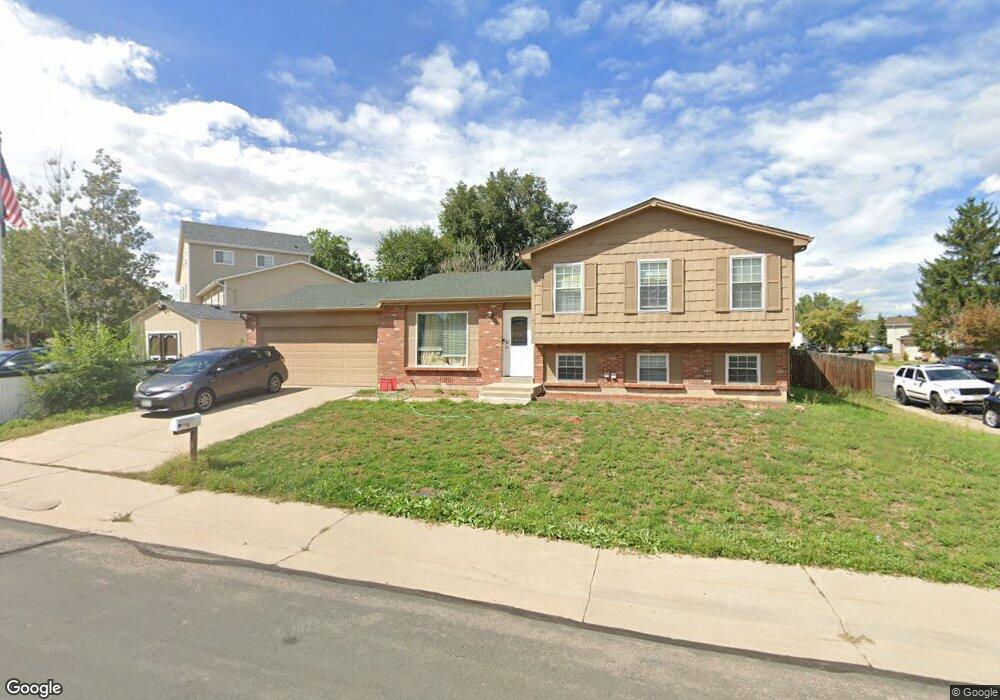
11125 Fairfax Ct Thornton, CO 80233
Grange Creek NeighborhoodEstimated Value: $448,488 - $491,000
4
Beds
2
Baths
1,736
Sq Ft
$270/Sq Ft
Est. Value
About This Home
This home is located at 11125 Fairfax Ct, Thornton, CO 80233 and is currently estimated at $469,372, approximately $270 per square foot. 11125 Fairfax Ct is a home located in Adams County with nearby schools including Riverdale Elementary School, Shadow Ridge Middle School, and Thornton High School.
Ownership History
Date
Name
Owned For
Owner Type
Purchase Details
Closed on
Jun 7, 2016
Sold by
Colfin Ai Co 1 Llc
Bought by
Csh 2016 1 Borrower Llc
Current Estimated Value
Purchase Details
Closed on
Dec 17, 2013
Sold by
Dodson Kristine and Dodson Larry C
Bought by
Colfin Ai Co 1 Llc
Purchase Details
Closed on
Dec 27, 2000
Sold by
Brian Hendrickson and Brian Brenda Hendrickson
Bought by
Dodson Kristine and Dodson Larry C
Home Financials for this Owner
Home Financials are based on the most recent Mortgage that was taken out on this home.
Original Mortgage
$163,651
Interest Rate
7.73%
Mortgage Type
FHA
Purchase Details
Closed on
Feb 23, 1996
Sold by
Delgado Brenda
Bought by
Hendrickson Brenda
Create a Home Valuation Report for This Property
The Home Valuation Report is an in-depth analysis detailing your home's value as well as a comparison with similar homes in the area
Home Values in the Area
Average Home Value in this Area
Purchase History
| Date | Buyer | Sale Price | Title Company |
|---|---|---|---|
| Csh 2016 1 Borrower Llc | -- | Os National Llc | |
| Colfin Ai Co 1 Llc | -- | None Available | |
| Dodson Kristine | $165,000 | North American Title Co | |
| Hendrickson Brenda | -- | -- |
Source: Public Records
Mortgage History
| Date | Status | Borrower | Loan Amount |
|---|---|---|---|
| Previous Owner | Dodson Kristine | $163,651 |
Source: Public Records
Tax History Compared to Growth
Tax History
| Year | Tax Paid | Tax Assessment Tax Assessment Total Assessment is a certain percentage of the fair market value that is determined by local assessors to be the total taxable value of land and additions on the property. | Land | Improvement |
|---|---|---|---|---|
| 2024 | $2,941 | $28,070 | $5,940 | $22,130 |
| 2023 | $2,911 | $32,140 | $6,090 | $26,050 |
| 2022 | $2,472 | $22,440 | $5,700 | $16,740 |
| 2021 | $2,555 | $22,440 | $5,700 | $16,740 |
| 2020 | $2,440 | $21,870 | $5,860 | $16,010 |
| 2019 | $2,445 | $21,870 | $5,860 | $16,010 |
| 2018 | $2,122 | $18,440 | $5,760 | $12,680 |
| 2017 | $1,929 | $18,440 | $5,760 | $12,680 |
| 2016 | $1,679 | $15,620 | $3,260 | $12,360 |
| 2015 | $1,676 | $15,620 | $3,260 | $12,360 |
| 2014 | $1,474 | $13,350 | $2,550 | $10,800 |
Source: Public Records
Map
Nearby Homes
- 11171 Forest Ave
- 4993 E 111th Place
- 11062 Fairfax Cir
- 11068 Eudora Cir
- 5056 E 112th Ct
- 4807 E 110th Place
- 5055 E 112th Ct
- 10985 Glencoe Place
- 11279 Holly St
- 10895 Fairfax Way
- 10979 Grange Creek Dr
- 10899 Grange Creek Dr
- 5303 E 113th Place
- 11135 Clermont Dr
- 11343 Grape Cir
- 4520 E 112th Place
- 11354 Jersey St
- 4346 E 113th Place
- 4645 E 106th Dr
- 10992 Albion Cir
- 11115 Fairfax Ct
- 11136 Fairfax Ct
- 11174 Forest Ave
- 11164 Forest Ave
- 11176 Forest Ave
- 11134 Eudora Place
- 11114 Eudora Place
- 11126 Fairfax Ct
- 11105 Fairfax Ct
- 11156 Forest Ave
- 11184 Forest Ave
- 11116 Fairfax Ct
- 11143 Forest Ave
- 11104 Eudora Place
- 11106 Fairfax Ct
- 5002 E 111th Place
- 11154 Forest Ave
- 5092 E 111th Place
- 11186 Forest Ave
- 4992 E 111th Place