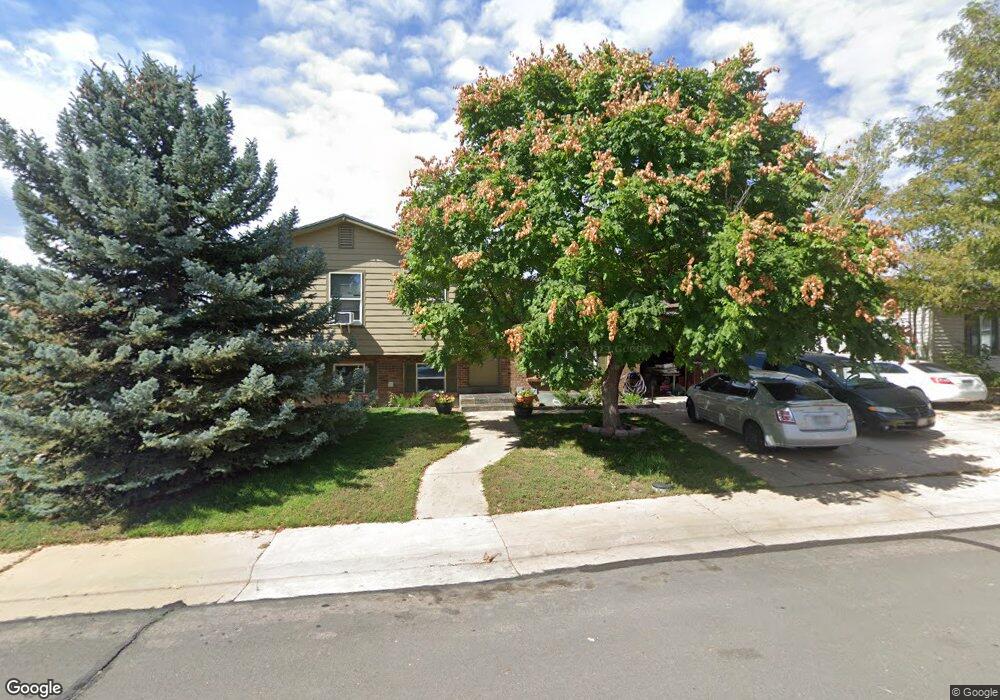
11129 Harris Way Thornton, CO 80233
Grange Creek NeighborhoodEstimated Value: $477,000 - $526,000
4
Beds
3
Baths
2,152
Sq Ft
$233/Sq Ft
Est. Value
About This Home
This home is located at 11129 Harris Way, Thornton, CO 80233 and is currently estimated at $502,170, approximately $233 per square foot. 11129 Harris Way is a home located in Adams County with nearby schools including Riverdale Elementary School, Shadow Ridge Middle School, and Thornton High School.
Ownership History
Date
Name
Owned For
Owner Type
Purchase Details
Closed on
Jan 30, 2025
Sold by
Slabeika Siarhei
Bought by
Slab Core Llc-11129 Harris-Series 4
Current Estimated Value
Purchase Details
Closed on
Jan 30, 2014
Sold by
Semenova Irina
Bought by
Slabelka Siarhei
Purchase Details
Closed on
Oct 24, 2013
Sold by
Bank Of America Na
Bought by
Semenova Irina
Purchase Details
Closed on
Aug 15, 2013
Sold by
Johnson Earl G and Johnson Florence Lisa
Bought by
Bank Of America Na
Purchase Details
Closed on
Jun 2, 1999
Sold by
Langley Robert D and Lyn Langley Debbie
Bought by
Johnson Earl G and Johnson Florence Lisa
Home Financials for this Owner
Home Financials are based on the most recent Mortgage that was taken out on this home.
Original Mortgage
$123,500
Interest Rate
7.02%
Create a Home Valuation Report for This Property
The Home Valuation Report is an in-depth analysis detailing your home's value as well as a comparison with similar homes in the area
Home Values in the Area
Average Home Value in this Area
Purchase History
| Date | Buyer | Sale Price | Title Company |
|---|---|---|---|
| Slab Core Llc-11129 Harris-Series 4 | -- | None Listed On Document | |
| Slabelka Siarhei | $100,000 | None Available | |
| Semenova Irina | $169,900 | None Available | |
| Bank Of America Na | -- | None Available | |
| Johnson Earl G | $130,000 | -- |
Source: Public Records
Mortgage History
| Date | Status | Borrower | Loan Amount |
|---|---|---|---|
| Previous Owner | Johnson Earl G | $123,500 |
Source: Public Records
Tax History Compared to Growth
Tax History
| Year | Tax Paid | Tax Assessment Tax Assessment Total Assessment is a certain percentage of the fair market value that is determined by local assessors to be the total taxable value of land and additions on the property. | Land | Improvement |
|---|---|---|---|---|
| 2024 | $3,362 | $31,630 | $5,940 | $25,690 |
| 2023 | $3,327 | $36,190 | $6,090 | $30,100 |
| 2022 | $2,648 | $24,040 | $5,700 | $18,340 |
| 2021 | $2,735 | $24,040 | $5,700 | $18,340 |
| 2020 | $2,621 | $23,490 | $5,860 | $17,630 |
| 2019 | $2,626 | $23,490 | $5,860 | $17,630 |
| 2018 | $2,318 | $20,140 | $5,760 | $14,380 |
| 2017 | $2,107 | $20,140 | $5,760 | $14,380 |
| 2016 | $1,867 | $17,370 | $3,260 | $14,110 |
| 2015 | $1,864 | $17,370 | $3,260 | $14,110 |
| 2014 | -- | $14,370 | $2,550 | $11,820 |
Source: Public Records
Map
Nearby Homes
- 11293 Holly St
- 11279 Holly St
- 11062 Fairfax Cir
- 10985 Glencoe Place
- 5056 E 112th Ct
- 10979 Grange Creek Dr
- 5055 E 112th Ct
- 11343 Grape Cir
- 11068 Eudora Cir
- 10899 Grange Creek Dr
- 4807 E 110th Place
- 11354 Jersey St
- 4911 E 112th Place
- 10895 Fairfax Way
- 11135 Clermont Dr
- 4520 E 112th Place
- 4645 E 106th Dr
- 4346 E 113th Place
- 10992 Albion Cir
- 11841 Elm Dr
- 11139 Harris Way
- 11119 Harris Way
- 5447 E 111th Dr
- 11118 Grape Ct
- 11109 Harris Way
- 11150 Harris Way
- 11108 Grape Ct
- 11170 Harris Way
- 11149 Harris Way
- 11130 Harris Way
- 5501 E 111th Place
- 11128 Grape Ct
- 11120 Harris Way
- 5521 E 111th Place
- 5448 E 111th Dr
- 11151 Hudson Place
- 5428 E 111th Dr
- 11171 Hudson Place
- 11110 Harris Way
- 5468 E 111th Dr