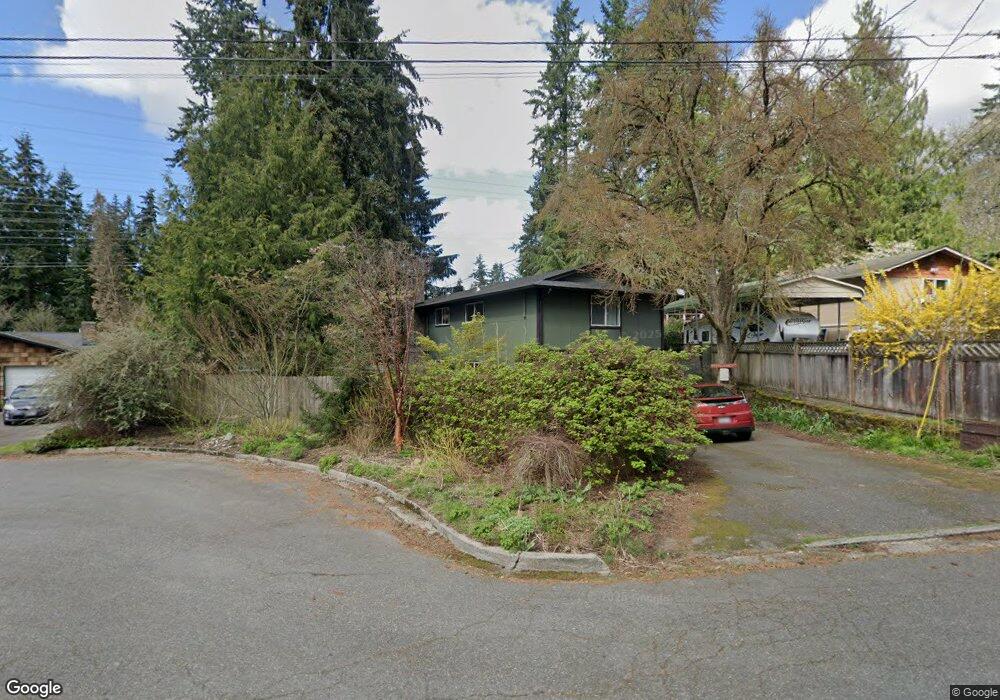
1113 213th Place SW Lynnwood, WA 98036
Queensborough-Brentwood NeighborhoodEstimated Value: $772,628 - $828,000
3
Beds
2
Baths
1,886
Sq Ft
$427/Sq Ft
Est. Value
About This Home
This home is located at 1113 213th Place SW, Lynnwood, WA 98036 and is currently estimated at $805,157, approximately $426 per square foot. 1113 213th Place SW is a home located in Snohomish County with nearby schools including Frank Love Elementary School, Kenmore Middle School, and Bothell High School.
Ownership History
Date
Name
Owned For
Owner Type
Purchase Details
Closed on
Sep 24, 2009
Sold by
Pfeifle David W
Bought by
Pfeifle David W and Pfeifle Kathleen R
Current Estimated Value
Home Financials for this Owner
Home Financials are based on the most recent Mortgage that was taken out on this home.
Original Mortgage
$257,556
Outstanding Balance
$169,633
Interest Rate
5.25%
Mortgage Type
FHA
Estimated Equity
$635,524
Purchase Details
Closed on
Oct 14, 2003
Sold by
Fall William E and Fall Janice M
Bought by
Pfeifle David W
Home Financials for this Owner
Home Financials are based on the most recent Mortgage that was taken out on this home.
Original Mortgage
$193,600
Interest Rate
6.19%
Mortgage Type
Purchase Money Mortgage
Purchase Details
Closed on
Nov 16, 1994
Sold by
Ross Harold J and Ross Nancy Ann
Bought by
Fall William E and Fall Janice M
Home Financials for this Owner
Home Financials are based on the most recent Mortgage that was taken out on this home.
Original Mortgage
$145,809
Interest Rate
8.92%
Mortgage Type
Assumption
Create a Home Valuation Report for This Property
The Home Valuation Report is an in-depth analysis detailing your home's value as well as a comparison with similar homes in the area
Home Values in the Area
Average Home Value in this Area
Purchase History
| Date | Buyer | Sale Price | Title Company |
|---|---|---|---|
| Pfeifle David W | -- | Fidelity National Title | |
| Pfeifle David W | $242,000 | First American Title Ins Co | |
| Fall William E | $142,950 | Stewart Title Co |
Source: Public Records
Mortgage History
| Date | Status | Borrower | Loan Amount |
|---|---|---|---|
| Open | Pfeifle David W | $257,556 | |
| Closed | Pfeifle David W | $193,600 | |
| Previous Owner | Fall William E | $145,809 | |
| Closed | Pfeifle David W | $48,400 |
Source: Public Records
Tax History Compared to Growth
Tax History
| Year | Tax Paid | Tax Assessment Tax Assessment Total Assessment is a certain percentage of the fair market value that is determined by local assessors to be the total taxable value of land and additions on the property. | Land | Improvement |
|---|---|---|---|---|
| 2025 | $5,302 | $666,800 | $474,600 | $192,200 |
| 2024 | $5,302 | $616,200 | $430,500 | $185,700 |
| 2023 | $6,110 | $772,000 | $577,300 | $194,700 |
| 2022 | $5,644 | $571,900 | $404,100 | $167,800 |
| 2020 | $4,826 | $439,800 | $301,200 | $138,600 |
| 2019 | $4,151 | $380,600 | $251,800 | $128,800 |
| 2018 | $3,920 | $338,500 | $223,300 | $115,200 |
| 2017 | $3,229 | $280,100 | $175,800 | $104,300 |
| 2016 | $3,041 | $256,900 | $156,800 | $100,100 |
| 2015 | $3,017 | $242,800 | $147,300 | $95,500 |
| 2013 | $2,808 | $200,800 | $120,700 | $80,100 |
Source: Public Records
Map
Nearby Homes
- 20914 13th Place W
- 604 213th St SW
- 0 Larch Way Unit NWM2427085
- 525 218th St SW
- 212 xx Cypress Way
- 20901 Cypress Way Unit 16
- 210 219th Place SW
- 114 212th St SE
- 1815 201st Place SW
- 20325 24th Place W
- 309 207th Place SE
- 317 207th St SE
- 612 228th St SW Unit K201
- 2612 204th St SW
- 22303 Old Poplar Way
- 738 211th Place SE
- 803 211th Place SE
- 722 211th Place SE
- 721 211th Place SE
- 2504 201st Place SW
- 1107 213th Place SW
- 1121 213th Place SW
- 1211 213th Place SW
- 1101 213th Place SW
- 1125 213th Place SW
- 1027 213th Place SW
- 1126 213th Place SW
- 1110 213th Place SW
- 1104 213th Place SW
- 1122 213th Place SW
- 21206 Elberta Rd
- 0 212th Place SW
- 21212 Elberta Rd
- 1026 213th Place SW
- 21312 11th Place W
- 21308 11th Place W
- 21316 11th Place W
- 21304 11th Place W
- 1120 211th Place SW
- 21320 11th Place W