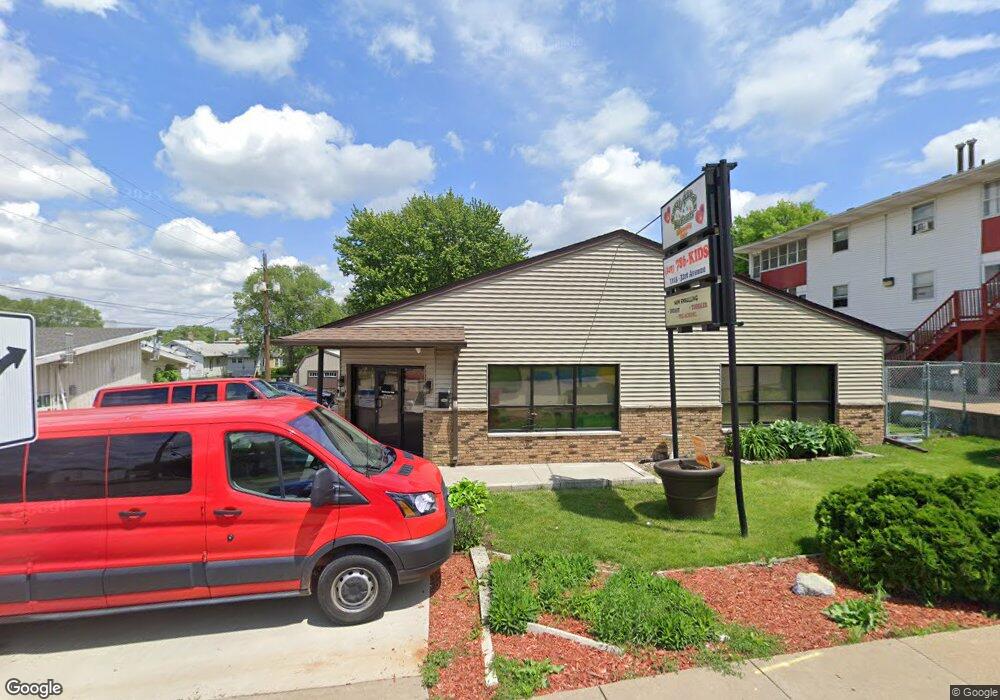
1113 31st Ave Rock Island, IL 61201
West Central Rock Island NeighborhoodEstimated Value: $126,304
--
Bed
--
Bath
2,960
Sq Ft
$43/Sq Ft
Est. Value
About This Home
This home is located at 1113 31st Ave, Rock Island, IL 61201 and is currently estimated at $126,304, approximately $42 per square foot. 1113 31st Ave is a home located in Rock Island County with nearby schools including Frances Willard Elementary School, Edison Jr High School, and Rock Island High School.
Ownership History
Date
Name
Owned For
Owner Type
Purchase Details
Closed on
Oct 7, 2019
Sold by
Mrs Ts Kids Inc
Bought by
Small Hands Big Hearts Llc
Current Estimated Value
Home Financials for this Owner
Home Financials are based on the most recent Mortgage that was taken out on this home.
Original Mortgage
$101,600
Outstanding Balance
$78,531
Interest Rate
3.5%
Mortgage Type
New Conventional
Estimated Equity
$47,773
Purchase Details
Closed on
Oct 4, 2019
Sold by
1113 31St Avenue Trust
Bought by
Mrs Ts Kids Inc
Home Financials for this Owner
Home Financials are based on the most recent Mortgage that was taken out on this home.
Original Mortgage
$101,600
Outstanding Balance
$78,531
Interest Rate
3.5%
Mortgage Type
New Conventional
Estimated Equity
$47,773
Purchase Details
Closed on
Jun 1, 1970
Create a Home Valuation Report for This Property
The Home Valuation Report is an in-depth analysis detailing your home's value as well as a comparison with similar homes in the area
Home Values in the Area
Average Home Value in this Area
Purchase History
| Date | Buyer | Sale Price | Title Company |
|---|---|---|---|
| Small Hands Big Hearts Llc | $120,000 | -- | |
| Mrs Ts Kids Inc | $90,000 | Brooks Law Firm Pc | |
| -- | $15,000 | -- |
Source: Public Records
Mortgage History
| Date | Status | Borrower | Loan Amount |
|---|---|---|---|
| Open | Small Hands Big Hearts Llc | $101,600 |
Source: Public Records
Tax History Compared to Growth
Tax History
| Year | Tax Paid | Tax Assessment Tax Assessment Total Assessment is a certain percentage of the fair market value that is determined by local assessors to be the total taxable value of land and additions on the property. | Land | Improvement |
|---|---|---|---|---|
| 2024 | $5,479 | $54,442 | $12,377 | $42,065 |
| 2023 | $5,479 | $49,810 | $11,324 | $38,486 |
| 2022 | $5,174 | $50,580 | $11,499 | $39,081 |
| 2021 | $5,070 | $48,034 | $10,920 | $37,114 |
| 2020 | $496 | $46,726 | $10,623 | $36,103 |
| 2019 | $4,911 | $46,264 | $10,518 | $35,746 |
| 2018 | $4,689 | $45,047 | $10,241 | $34,806 |
| 2017 | $4,559 | $43,550 | $9,901 | $33,649 |
| 2016 | $4,423 | $43,550 | $9,901 | $33,649 |
| 2015 | $4,418 | $43,550 | $9,901 | $33,649 |
| 2014 | $1,066 | $43,879 | $9,976 | $33,903 |
| 2013 | $1,066 | $43,879 | $9,976 | $33,903 |
Source: Public Records
Map
Nearby Homes