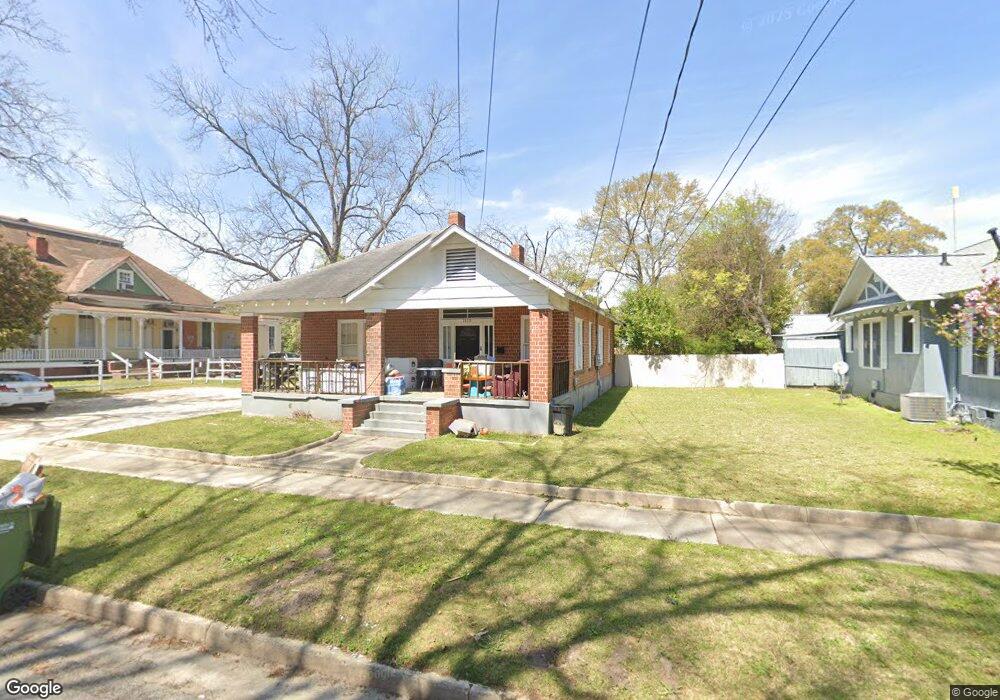
1113 32nd St Columbus, GA 31904
North Columbus NeighborhoodEstimated Value: $90,000 - $132,000
2
Beds
3
Baths
1,336
Sq Ft
$88/Sq Ft
Est. Value
About This Home
This home is located at 1113 32nd St, Columbus, GA 31904 and is currently estimated at $117,347, approximately $87 per square foot. 1113 32nd St is a home located in Muscogee County with nearby schools including Johnson Elementary School, Arnold Middle School, and Jordan Vocational High School.
Ownership History
Date
Name
Owned For
Owner Type
Purchase Details
Closed on
Dec 21, 2021
Sold by
Cf Properties Llc
Bought by
Columbus 26 Partners Llc
Current Estimated Value
Purchase Details
Closed on
Jan 10, 2019
Sold by
Big Mamas Stuff Llc
Bought by
Cf Properties Llc
Purchase Details
Closed on
Jun 30, 2014
Sold by
Rivertown Development Llc
Bought by
Fam Investments Llc
Create a Home Valuation Report for This Property
The Home Valuation Report is an in-depth analysis detailing your home's value as well as a comparison with similar homes in the area
Home Values in the Area
Average Home Value in this Area
Purchase History
| Date | Buyer | Sale Price | Title Company |
|---|---|---|---|
| Columbus 26 Partners Llc | $5,349,254 | -- | |
| Cf Properties Llc | -- | -- | |
| Big Mamas Stuff Llc | $31,000 | -- | |
| Fam Investments Llc | -- | -- |
Source: Public Records
Tax History Compared to Growth
Tax History
| Year | Tax Paid | Tax Assessment Tax Assessment Total Assessment is a certain percentage of the fair market value that is determined by local assessors to be the total taxable value of land and additions on the property. | Land | Improvement |
|---|---|---|---|---|
| 2025 | $4,526 | $44,764 | $7,968 | $36,796 |
| 2024 | $2,338 | $44,764 | $7,968 | $36,796 |
| 2023 | $491 | $12,456 | $7,968 | $4,488 |
| 2022 | $509 | $26,892 | $7,968 | $18,924 |
| 2021 | $230 | $24,196 | $7,968 | $16,228 |
| 2020 | $230 | $5,636 | $3,257 | $2,379 |
| 2019 | $763 | $21,908 | $7,968 | $13,940 |
| 2018 | $898 | $21,908 | $7,968 | $13,940 |
| 2017 | $933 | $21,908 | $7,968 | $13,940 |
| 2016 | $655 | $15,870 | $2,990 | $12,880 |
| 2015 | $404 | $24,463 | $2,990 | $21,473 |
| 2014 | $1,012 | $24,463 | $2,990 | $21,473 |
| 2013 | -- | $24,463 | $2,990 | $21,473 |
Source: Public Records
Map
Nearby Homes