1113 90th St Niagara Falls, NY 14304
LaSalle NeighborhoodEstimated Value: $119,000 - $158,000
3
Beds
1
Bath
864
Sq Ft
$162/Sq Ft
Est. Value
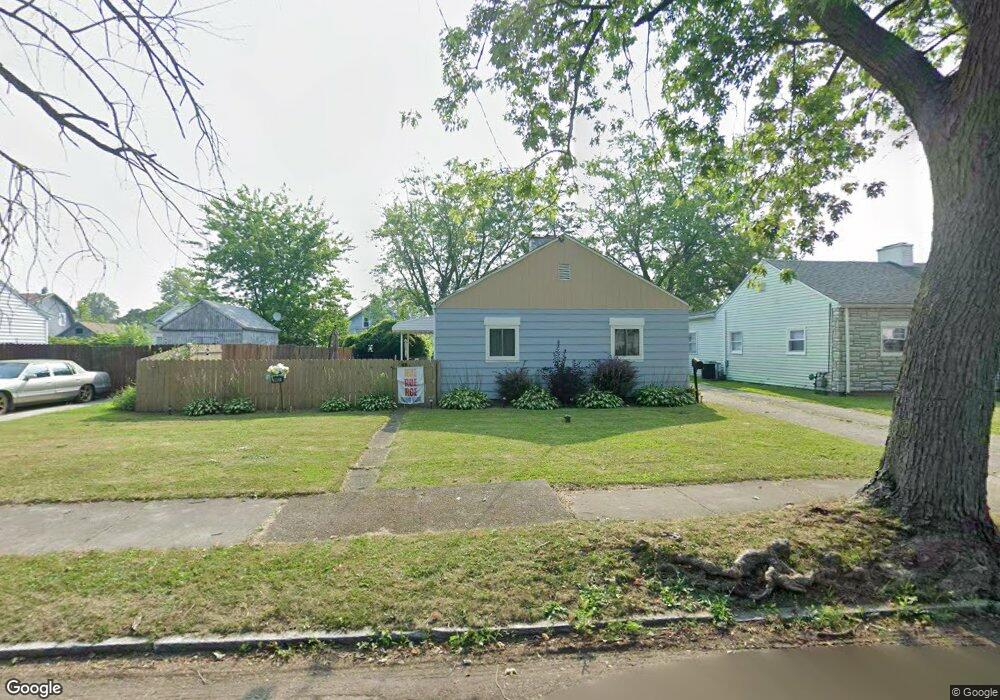
About This Home
This home is located at 1113 90th St, Niagara Falls, NY 14304 and is currently estimated at $139,985, approximately $162 per square foot. 1113 90th St is a home located in Niagara County with nearby schools including Niagara Falls High School, Christ the King Preparatory Academy, and Catholic Academy Of Niagara Falls - Elementary.
Ownership History
Date
Name
Owned For
Owner Type
Purchase Details
Closed on
Nov 13, 2009
Sold by
Berry Curry Helen Estate
Bought by
Ross Lumon
Current Estimated Value
Home Financials for this Owner
Home Financials are based on the most recent Mortgage that was taken out on this home.
Original Mortgage
$35,000
Outstanding Balance
$22,830
Interest Rate
4.98%
Mortgage Type
New Conventional
Estimated Equity
$117,155
Purchase Details
Closed on
Nov 11, 2009
Sold by
Ross Nancy A and Curry Helen L
Bought by
Ross Lumon James and Ross Nancy A
Home Financials for this Owner
Home Financials are based on the most recent Mortgage that was taken out on this home.
Original Mortgage
$35,000
Outstanding Balance
$22,830
Interest Rate
4.98%
Mortgage Type
New Conventional
Estimated Equity
$117,155
Create a Home Valuation Report for This Property
The Home Valuation Report is an in-depth analysis detailing your home's value as well as a comparison with similar homes in the area
Home Values in the Area
Average Home Value in this Area
Purchase History
| Date | Buyer | Sale Price | Title Company |
|---|---|---|---|
| Ross Lumon | $37,000 | Gary Gerace | |
| Ross Lumon James | $37,000 | None Available |
Source: Public Records
Mortgage History
| Date | Status | Borrower | Loan Amount |
|---|---|---|---|
| Open | Ross Lumon James | $35,000 |
Source: Public Records
Tax History Compared to Growth
Tax History
| Year | Tax Paid | Tax Assessment Tax Assessment Total Assessment is a certain percentage of the fair market value that is determined by local assessors to be the total taxable value of land and additions on the property. | Land | Improvement |
|---|---|---|---|---|
| 2024 | $3,097 | $53,200 | $4,100 | $49,100 |
| 2023 | $2,069 | $53,200 | $4,100 | $49,100 |
| 2022 | $1,556 | $53,200 | $4,100 | $49,100 |
| 2021 | $1,556 | $53,200 | $4,100 | $49,100 |
| 2020 | $1,032 | $53,200 | $4,100 | $49,100 |
| 2019 | $991 | $53,200 | $4,100 | $49,100 |
| 2018 | $1,529 | $53,200 | $4,100 | $49,100 |
| 2017 | $991 | $53,200 | $4,100 | $49,100 |
| 2016 | $1,486 | $53,200 | $4,100 | $49,100 |
| 2015 | -- | $53,200 | $4,100 | $49,100 |
| 2014 | -- | $53,200 | $4,100 | $49,100 |
Source: Public Records
Map
Nearby Homes