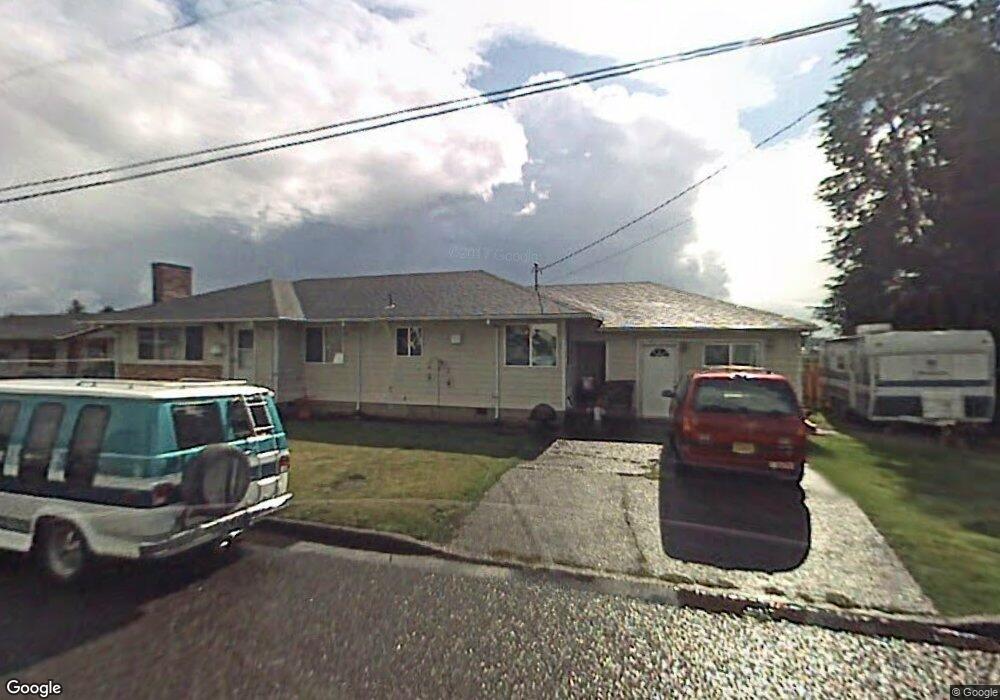
1113 9th St Tillamook, OR 97141
Estimated Value: $371,567 - $448,000
4
Beds
2
Baths
2,225
Sq Ft
$181/Sq Ft
Est. Value
About This Home
This home is located at 1113 9th St, Tillamook, OR 97141 and is currently estimated at $402,142, approximately $180 per square foot. 1113 9th St is a home located in Tillamook County with nearby schools including Tillamook High School, Little Clipper Preschool, and Tillamook Adventist School.
Ownership History
Date
Name
Owned For
Owner Type
Purchase Details
Closed on
Mar 10, 2001
Sold by
Hallowell Harvey N and Hallowell Lorraine G
Bought by
Hanakahi Sterling and Hanakahi Anita
Current Estimated Value
Create a Home Valuation Report for This Property
The Home Valuation Report is an in-depth analysis detailing your home's value as well as a comparison with similar homes in the area
Home Values in the Area
Average Home Value in this Area
Purchase History
| Date | Buyer | Sale Price | Title Company |
|---|---|---|---|
| Hanakahi Sterling | $100,000 | None Available |
Source: Public Records
Tax History Compared to Growth
Tax History
| Year | Tax Paid | Tax Assessment Tax Assessment Total Assessment is a certain percentage of the fair market value that is determined by local assessors to be the total taxable value of land and additions on the property. | Land | Improvement |
|---|---|---|---|---|
| 2024 | $1,841 | $186,820 | $49,320 | $137,500 |
| 2023 | $1,824 | $181,380 | $47,880 | $133,500 |
| 2022 | $1,762 | $176,100 | $46,490 | $129,610 |
| 2021 | $1,710 | $170,980 | $45,140 | $125,840 |
| 2020 | $1,663 | $166,000 | $43,830 | $122,170 |
| 2019 | $1,621 | $161,170 | $42,550 | $118,620 |
| 2018 | $1,887 | $156,480 | $41,310 | $115,170 |
| 2017 | $1,220 | $125,360 | $40,110 | $85,250 |
| 2016 | $1,174 | $121,710 | $38,940 | $82,770 |
| 2015 | $1,151 | $118,170 | $37,810 | $80,360 |
| 2014 | $1,131 | $114,730 | $36,710 | $78,020 |
| 2013 | -- | $111,390 | $35,640 | $75,750 |
Source: Public Records
Map
Nearby Homes