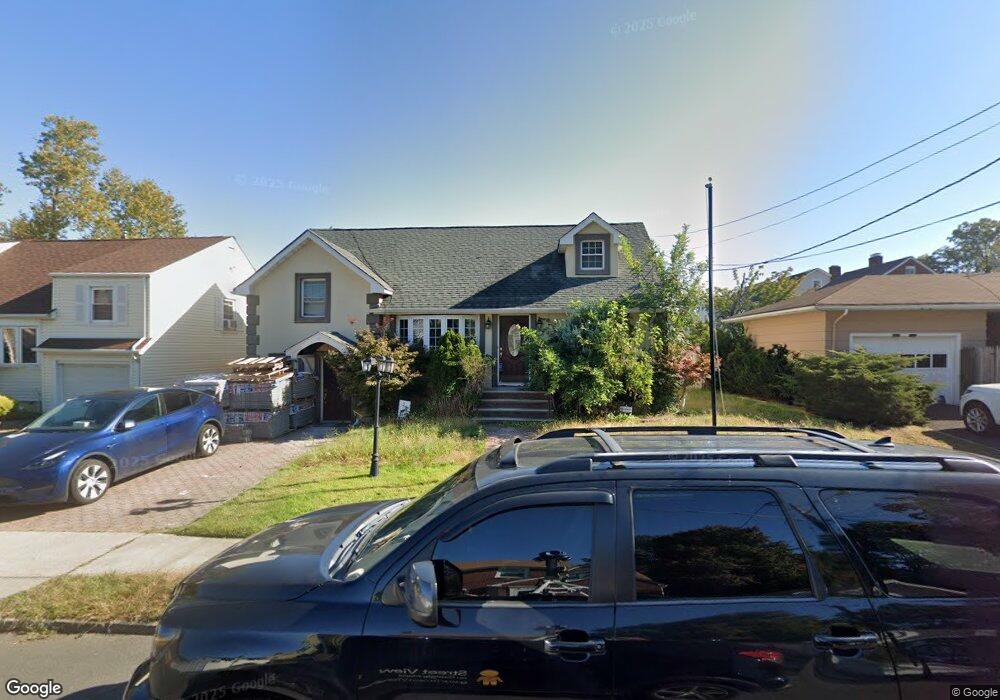
1113 Byron Ave Unit 1117 Elizabeth, NJ 07208
Elmora NeighborhoodEstimated Value: $493,000
4
Beds
3
Baths
2,176
Sq Ft
$227/Sq Ft
Est. Value
About This Home
This home is located at 1113 Byron Ave Unit 1117, Elizabeth, NJ 07208 and is currently estimated at $493,000, approximately $226 per square foot. 1113 Byron Ave Unit 1117 is a home located in Union County with nearby schools including Number 21, Victor Mravlag Elementary School, Elizabeth High School, and Jewish Educational Center Lower School.
Ownership History
Date
Name
Owned For
Owner Type
Purchase Details
Closed on
Jun 23, 2021
Sold by
Roberto Alfredo C and Andrade Carlos
Bought by
Famenini Shaya
Current Estimated Value
Home Financials for this Owner
Home Financials are based on the most recent Mortgage that was taken out on this home.
Original Mortgage
$400,000
Outstanding Balance
$362,150
Interest Rate
2.9%
Mortgage Type
New Conventional
Estimated Equity
$130,850
Purchase Details
Closed on
Dec 14, 2017
Sold by
Blessing Carl and Marcial Eileen
Bought by
Gomez Edgar A and Angel Gomez Alexandra M
Home Financials for this Owner
Home Financials are based on the most recent Mortgage that was taken out on this home.
Original Mortgage
$245,471
Interest Rate
3.75%
Mortgage Type
FHA
Purchase Details
Closed on
Feb 26, 2008
Sold by
Bober Paul
Bought by
Bober Paul
Purchase Details
Closed on
Jan 22, 2002
Sold by
Anderson Karen and Nilsen Janet
Bought by
Bober Helen and Bober Paul
Create a Home Valuation Report for This Property
The Home Valuation Report is an in-depth analysis detailing your home's value as well as a comparison with similar homes in the area
Home Values in the Area
Average Home Value in this Area
Purchase History
| Date | Buyer | Sale Price | Title Company |
|---|---|---|---|
| Famenini Shaya | $500,000 | Land Title | |
| Famenini Shaya | $500,000 | Land Title | |
| Gomez Edgar A | $250,000 | Mega Title Llc | |
| Bober Paul | -- | None Available | |
| Bober Helen | -- | -- | |
| Bober Helen | -- | -- |
Source: Public Records
Mortgage History
| Date | Status | Borrower | Loan Amount |
|---|---|---|---|
| Open | Famenini Shaya | $400,000 | |
| Closed | Famenini Shaya | $400,000 | |
| Previous Owner | Gomez Edgar A | $245,471 |
Source: Public Records
Tax History Compared to Growth
Tax History
| Year | Tax Paid | Tax Assessment Tax Assessment Total Assessment is a certain percentage of the fair market value that is determined by local assessors to be the total taxable value of land and additions on the property. | Land | Improvement |
|---|---|---|---|---|
| 2025 | $10,403 | $540,700 | $235,500 | $305,200 |
| 2024 | $13,421 | $540,700 | $235,500 | $305,200 |
| 2023 | $13,421 | $42,700 | $12,300 | $30,400 |
| 2022 | $9,174 | $30,000 | $8,400 | $21,600 |
| 2021 | $8,984 | $30,000 | $8,400 | $21,600 |
| 2020 | $8,781 | $30,000 | $8,400 | $21,600 |
| 2019 | $8,647 | $30,000 | $8,400 | $21,600 |
| 2018 | $8,563 | $30,000 | $8,400 | $21,600 |
| 2017 | $8,324 | $30,000 | $8,400 | $21,600 |
| 2016 | $8,325 | $30,000 | $8,400 | $21,600 |
| 2015 | $7,580 | $30,000 | $8,400 | $21,600 |
| 2014 | $7,345 | $30,000 | $8,400 | $21,600 |
Source: Public Records
Map
Nearby Homes
- 275 Clermont Terrace
- 1134-1138 Kipling Rd
- 686 Gates Terrace
- 45 Summit Rd Unit 47
- 341 Trotting Rd
- 819 Greenwich Ln
- 309 Palisade Rd Unit 323
- 536 Lehigh Ave
- 13-15 Hillside Rd
- 138 Monmouth Rd Unit 40
- 578 Winchester Ave
- 362 E Clay Ave
- 865 Westfield Ave
- 137-139 Monmouth Rd
- 403 Foxwood Rd
- 220 Sherman Ave
- 214 Sherman Ave
- 161 Morristown Rd Unit 63
- 619 Spruce St
- 1031 Lowden Ave
- 1113-1117 Byron Ave
- 1119 Byron Ave Unit 1123
- 176 Browning Ave Unit 184
- 1156 Magie Ave
- 1112 Byron Ave Unit 16
- 186 Browning Ave Unit 190
- 1100 Byron Ave Unit 10
- 192 Browning Ave Unit 94
- 1169 Magie Ave
- 1163 Magie Ave
- 1182 Magie Ave Unit 1184
- 196 Browning Ave Unit 98
- 1157 Magie Ave
- 162 Browning Ave Unit 64
- 1175 Magie Ave
- 1142 Magie Ave Unit 1144
- 1153 Magie Ave
- 200 Browning Ave Unit 2
- 1186 Magie Ave Unit 90
- 179 Browning Ave Unit 85