Estimated Value: $127,031 - $219,000
3
Beds
3
Baths
1,583
Sq Ft
$108/Sq Ft
Est. Value
About This Home
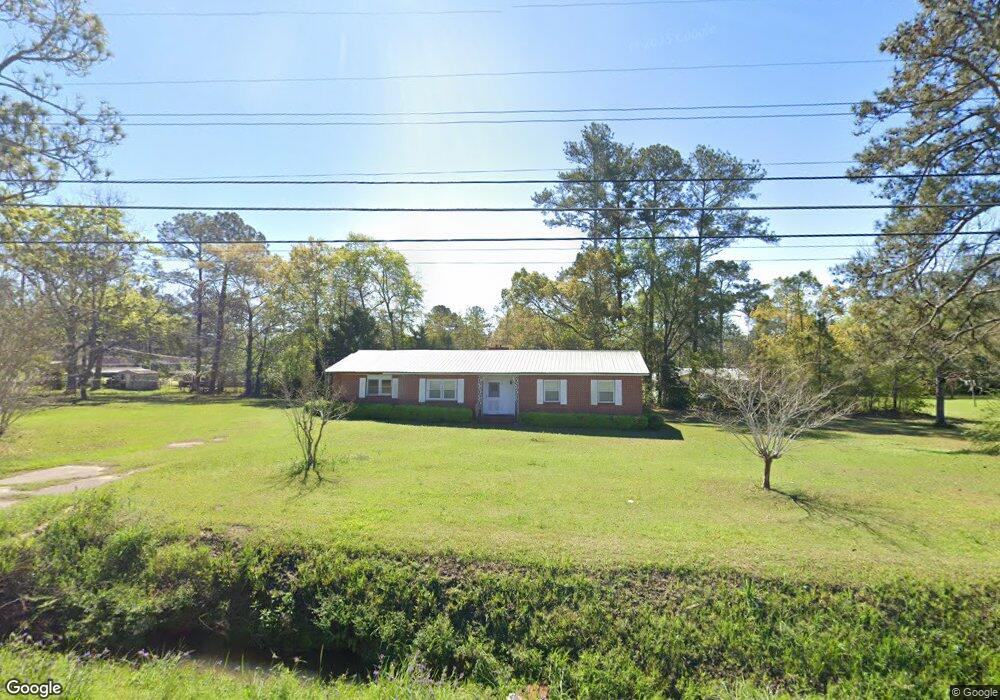
This home is located at 1113 Calvary Rd SW, Cairo, GA 39828 and is currently estimated at $170,258, approximately $107 per square foot. 1113 Calvary Rd SW is a home with nearby schools including Cairo High School.
Ownership History
Date
Name
Owned For
Owner Type
Purchase Details
Closed on
Nov 1, 2006
Sold by
Mccord Stacy
Bought by
Mccord Iris and Mccord Ivey
Current Estimated Value
Purchase Details
Closed on
Oct 31, 2006
Sold by
Mccord Toby
Bought by
Mccord Iris and Mccord Ivey
Purchase Details
Closed on
Jun 14, 2004
Sold by
Prophetcenter Llc
Bought by
Mccord Stacy
Purchase Details
Closed on
Sep 19, 2002
Sold by
Mccord Iris
Bought by
Prophetcenter Llc
Purchase Details
Closed on
Dec 29, 1993
Bought by
Mccord Iris
Create a Home Valuation Report for This Property
The Home Valuation Report is an in-depth analysis detailing your home's value as well as a comparison with similar homes in the area
Home Values in the Area
Average Home Value in this Area
Purchase History
| Date | Buyer | Sale Price | Title Company |
|---|---|---|---|
| Mccord Iris | -- | -- | |
| Mccord Iris | -- | -- | |
| Mccord Stacy | -- | -- | |
| Prophetcenter Llc | -- | -- | |
| Mccord Iris | -- | -- |
Source: Public Records
Tax History Compared to Growth
Tax History
| Year | Tax Paid | Tax Assessment Tax Assessment Total Assessment is a certain percentage of the fair market value that is determined by local assessors to be the total taxable value of land and additions on the property. | Land | Improvement |
|---|---|---|---|---|
| 2024 | $2,087 | $54,456 | $2,080 | $52,376 |
| 2023 | $1,214 | $34,474 | $2,794 | $31,680 |
| 2022 | $1,266 | $34,474 | $2,794 | $31,680 |
| 2021 | $1,269 | $34,474 | $2,794 | $31,680 |
| 2020 | $1,273 | $34,474 | $2,794 | $31,680 |
| 2019 | $1,272 | $34,474 | $2,794 | $31,680 |
| 2018 | $1,210 | $34,474 | $2,794 | $31,680 |
| 2017 | $1,164 | $34,474 | $2,794 | $31,680 |
| 2016 | $987 | $28,834 | $2,794 | $26,040 |
| 2015 | $978 | $28,834 | $2,794 | $26,040 |
| 2014 | $978 | $28,834 | $2,794 | $26,040 |
| 2013 | -- | $26,418 | $2,793 | $23,625 |
Source: Public Records
Map
Nearby Homes
- 425 8th St SW
- 320 8th St SW
- 490 13th St SW
- 786 Madison Ln
- 1385 Martin Luther King Junior Ave
- 000 1st Ave SW
- 117 6th St SW
- 460 2nd St SW
- 000 Hwy 111 South 20 59 Acres
- 0 Collins Rd
- 000 Collins Rd
- 112 Pine Cir SW
- 40 5th Ave SW
- 117 Pine Cir SW
- 720 1st St SW
- 27 6th Ave SW
- 109 Oriac Ave SW
- 000 S Broad St
- X 1st St
- 00 Hwy 111 South Tract 1
- 940 Grant Ave SW
- 950 Grant Ave SW
- 910 Grant Ave SW
- 935 Grant Ave SW
- 495 9th St SW
- 515 N Washington Dr
- 813 Calvary Rd SW
- 510 N Washington Dr
- 537 9th St SW
- 545 N Washington Dr
- 530 N Washington Dr
- 508 8th St SW
- 2577 Georgia 111
- 0 Georgia 111
- 44 acres Georgia 111
- 9.13acre Georgia 111
- 0000 Georgia 111
- 560 N Washington Dr
- 585 N Washington Dr
- 809 Calvary Rd SW