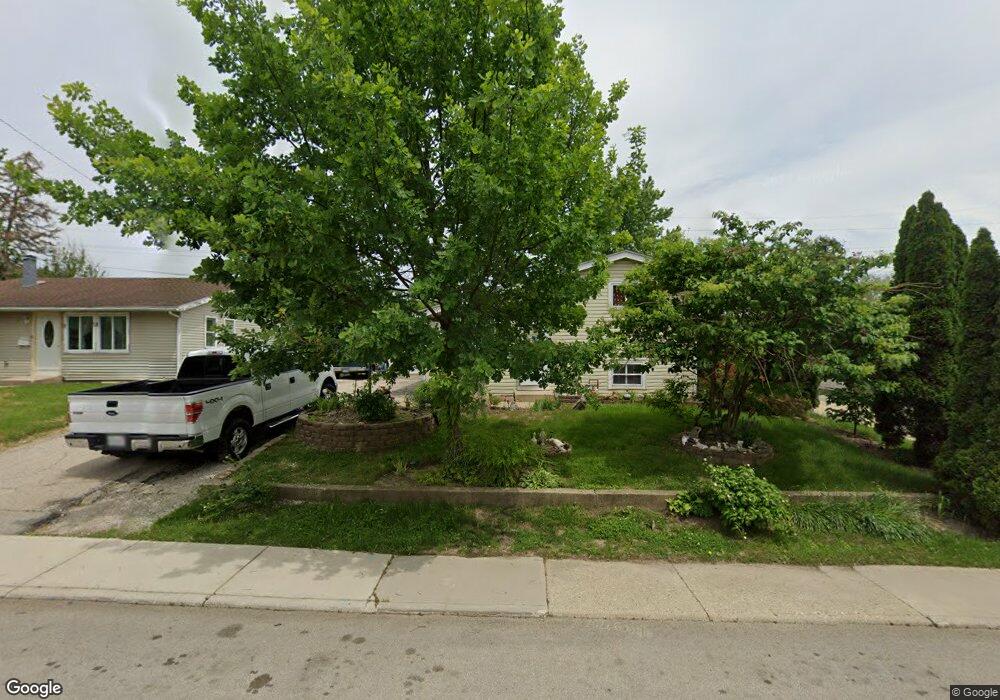
1113 Denver Dr Carpentersville, IL 60110
Estimated Value: $279,000 - $319,000
6
Beds
3
Baths
1,800
Sq Ft
$166/Sq Ft
Est. Value
About This Home
This home is located at 1113 Denver Dr, Carpentersville, IL 60110 and is currently estimated at $299,143, approximately $166 per square foot. 1113 Denver Dr is a home located in Kane County with nearby schools including Lakewood School, Crescent City Grade School, and Carpentersville Middle School.
Ownership History
Date
Name
Owned For
Owner Type
Purchase Details
Closed on
Jul 21, 2012
Sold by
Castillo Humberto and Olvera De Castillo Leticia R
Bought by
Castillo Humberto and Olvera De Castillo Leticia R
Current Estimated Value
Purchase Details
Closed on
Mar 19, 2004
Sold by
Silva Minerva and Rosales Jose Luis
Bought by
Castillo Humberto and Castillo Panuncio
Home Financials for this Owner
Home Financials are based on the most recent Mortgage that was taken out on this home.
Original Mortgage
$145,500
Outstanding Balance
$67,905
Interest Rate
5.65%
Mortgage Type
Purchase Money Mortgage
Estimated Equity
$231,238
Purchase Details
Closed on
Jul 6, 2001
Sold by
Mihina Matthew
Bought by
Silva Minerva and Rosales Gabriela B
Home Financials for this Owner
Home Financials are based on the most recent Mortgage that was taken out on this home.
Original Mortgage
$113,680
Interest Rate
7.2%
Mortgage Type
FHA
Create a Home Valuation Report for This Property
The Home Valuation Report is an in-depth analysis detailing your home's value as well as a comparison with similar homes in the area
Home Values in the Area
Average Home Value in this Area
Purchase History
| Date | Buyer | Sale Price | Title Company |
|---|---|---|---|
| Castillo Humberto | -- | Chicago Title Insurance Comp | |
| Castillo Humberto | $154,000 | -- | |
| Silva Minerva | $115,500 | First American Title Ins Co |
Source: Public Records
Mortgage History
| Date | Status | Borrower | Loan Amount |
|---|---|---|---|
| Open | Castillo Humberto | $145,500 | |
| Previous Owner | Silva Minerva | $113,680 |
Source: Public Records
Tax History Compared to Growth
Tax History
| Year | Tax Paid | Tax Assessment Tax Assessment Total Assessment is a certain percentage of the fair market value that is determined by local assessors to be the total taxable value of land and additions on the property. | Land | Improvement |
|---|---|---|---|---|
| 2024 | $5,573 | $81,590 | $12,553 | $69,037 |
| 2023 | $5,496 | $73,412 | $11,295 | $62,117 |
| 2022 | $5,507 | $69,247 | $11,295 | $57,952 |
| 2021 | $5,379 | $65,383 | $10,665 | $54,718 |
| 2020 | $5,291 | $63,913 | $10,425 | $53,488 |
| 2019 | $5,173 | $60,674 | $9,897 | $50,777 |
| 2018 | $5,416 | $54,575 | $9,701 | $44,874 |
| 2017 | $5,237 | $51,053 | $9,075 | $41,978 |
| 2016 | $4,866 | $44,232 | $8,787 | $35,445 |
| 2015 | -- | $38,243 | $8,234 | $30,009 |
| 2014 | -- | $34,061 | $8,007 | $26,054 |
| 2013 | -- | $35,104 | $8,252 | $26,852 |
Source: Public Records
Map
Nearby Homes
- 4 Austin Ave
- 7 Austin Ave
- 57 Robin Rd
- 7 Hickory Dr
- 327 Tulsa Ave
- 103 Hickory Dr
- 149 Austin Ave
- 181 Skyline Dr
- 94 Wren Rd
- 140 Hickory Dr
- 944 Cortney Dr
- 1426 Kings Rd
- 1317 Brookdale Dr
- 1040 Rosewood Dr
- 1244 Brookdale Dr
- 171 Lake Shore Dr
- 105 Siesta Rd
- 494 Rosewood Dr
- 1017 Brookdale Dr Unit 1017
- 1203 Brookdale Dr