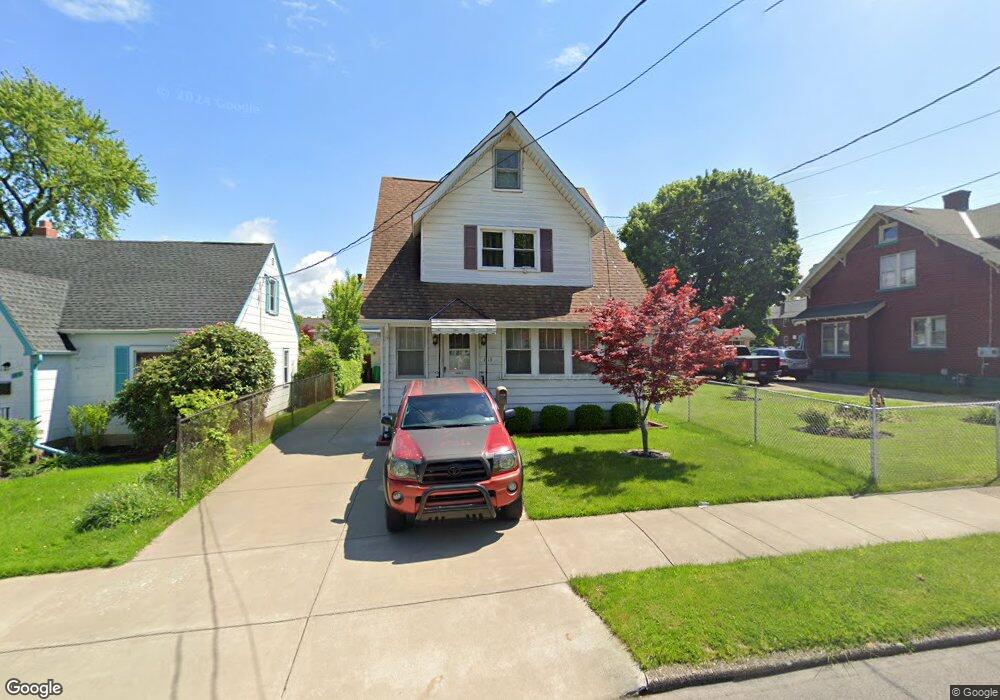
1113 E 3rd St Erie, PA 16507
Pulaski Lighthouse NeighborhoodEstimated Value: $64,000 - $93,000
3
Beds
1
Bath
1,134
Sq Ft
$68/Sq Ft
Est. Value
About This Home
This home is located at 1113 E 3rd St, Erie, PA 16507 and is currently estimated at $76,839, approximately $67 per square foot. 1113 E 3rd St is a home located in Erie County with nearby schools including Edison Elementary School, East Middle School, and Erie High School.
Ownership History
Date
Name
Owned For
Owner Type
Purchase Details
Closed on
Mar 22, 2010
Sold by
Deutsche Bank National Trust
Bought by
Widger Michael P
Current Estimated Value
Purchase Details
Closed on
Jul 30, 2009
Sold by
Ferringer Melissa R
Bought by
Deutsche Bank National Trust Company
Purchase Details
Closed on
Dec 4, 2006
Sold by
Piskorski Dennis G
Bought by
Ferringer Melissa R
Home Financials for this Owner
Home Financials are based on the most recent Mortgage that was taken out on this home.
Original Mortgage
$61,275
Interest Rate
10.55%
Mortgage Type
Purchase Money Mortgage
Purchase Details
Closed on
Aug 24, 2001
Sold by
Heubel Patricia R and Heubel James P
Bought by
Piskorski Dennis G
Home Financials for this Owner
Home Financials are based on the most recent Mortgage that was taken out on this home.
Original Mortgage
$28,800
Interest Rate
7.21%
Create a Home Valuation Report for This Property
The Home Valuation Report is an in-depth analysis detailing your home's value as well as a comparison with similar homes in the area
Home Values in the Area
Average Home Value in this Area
Purchase History
| Date | Buyer | Sale Price | Title Company |
|---|---|---|---|
| Widger Michael P | $24,553 | None Available | |
| Deutsche Bank National Trust Company | $2,139 | None Available | |
| Ferringer Melissa R | $40,200 | None Available | |
| Piskorski Dennis G | $32,000 | -- |
Source: Public Records
Mortgage History
| Date | Status | Borrower | Loan Amount |
|---|---|---|---|
| Previous Owner | Ferringer Melissa R | $61,275 | |
| Previous Owner | Piskorski Dennis G | $28,800 |
Source: Public Records
Tax History
| Year | Tax Paid | Tax Assessment Tax Assessment Total Assessment is a certain percentage of the fair market value that is determined by local assessors to be the total taxable value of land and additions on the property. | Land | Improvement |
|---|---|---|---|---|
| 2025 | $1,606 | $40,630 | $8,500 | $32,130 |
| 2024 | $1,572 | $40,630 | $8,500 | $32,130 |
| 2023 | $1,527 | $40,630 | $8,500 | $32,130 |
| 2022 | $1,495 | $40,630 | $8,500 | $32,130 |
| 2021 | $1,474 | $40,630 | $8,500 | $32,130 |
| 2020 | $1,464 | $40,630 | $8,500 | $32,130 |
| 2019 | $1,388 | $40,630 | $8,500 | $32,130 |
| 2018 | $1,372 | $40,630 | $8,500 | $32,130 |
| 2017 | $1,369 | $40,630 | $8,500 | $32,130 |
| 2016 | $1,536 | $40,630 | $8,500 | $32,130 |
| 2015 | $1,526 | $40,630 | $8,500 | $32,130 |
| 2014 | $1,317 | $40,630 | $8,500 | $32,130 |
Source: Public Records
Map
Nearby Homes
Your Personal Tour Guide
Ask me questions while you tour the home.