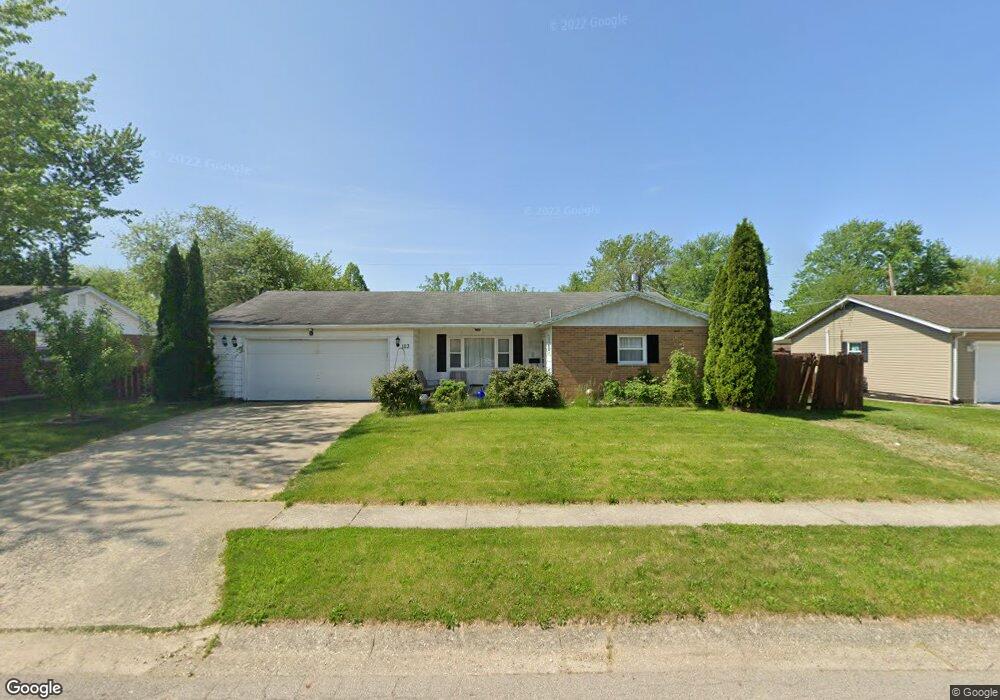
1113 Edgebrook Dr New Carlisle, OH 45344
Estimated Value: $180,736 - $193,000
3
Beds
2
Baths
1,155
Sq Ft
$160/Sq Ft
Est. Value
About This Home
This home is located at 1113 Edgebrook Dr, New Carlisle, OH 45344 and is currently estimated at $184,434, approximately $159 per square foot. 1113 Edgebrook Dr is a home located in Clark County with nearby schools including New Carlisle Elementary School, Park Layne Elementary School, and Donnelsville Elementary School.
Ownership History
Date
Name
Owned For
Owner Type
Purchase Details
Closed on
Nov 18, 2014
Sold by
Jpmorgan Chase Bank Na
Bought by
Esparza Cynthia
Current Estimated Value
Home Financials for this Owner
Home Financials are based on the most recent Mortgage that was taken out on this home.
Original Mortgage
$46,148
Outstanding Balance
$35,481
Interest Rate
4.1%
Mortgage Type
FHA
Estimated Equity
$148,953
Purchase Details
Closed on
Jul 31, 2014
Sold by
Hughes John E
Bought by
Jpmorgan Chase Bank Na
Purchase Details
Closed on
Jan 28, 2010
Sold by
Dorn Jewell L
Bought by
Hughes John E
Home Financials for this Owner
Home Financials are based on the most recent Mortgage that was taken out on this home.
Original Mortgage
$77,449
Interest Rate
5%
Mortgage Type
New Conventional
Purchase Details
Closed on
Aug 4, 1993
Bought by
Dorn Jewell L Trustee
Purchase Details
Closed on
Apr 29, 1992
Create a Home Valuation Report for This Property
The Home Valuation Report is an in-depth analysis detailing your home's value as well as a comparison with similar homes in the area
Home Values in the Area
Average Home Value in this Area
Purchase History
| Date | Buyer | Sale Price | Title Company |
|---|---|---|---|
| Esparza Cynthia | $47,000 | Ohio Real Estate Title | |
| Jpmorgan Chase Bank Na | $55,000 | Attorney | |
| Hughes John E | $75,900 | Attorney | |
| Dorn Jewell L Trustee | -- | -- | |
| -- | -- | -- |
Source: Public Records
Mortgage History
| Date | Status | Borrower | Loan Amount |
|---|---|---|---|
| Open | Esparza Cynthia | $46,148 | |
| Previous Owner | Hughes John E | $77,449 |
Source: Public Records
Tax History Compared to Growth
Tax History
| Year | Tax Paid | Tax Assessment Tax Assessment Total Assessment is a certain percentage of the fair market value that is determined by local assessors to be the total taxable value of land and additions on the property. | Land | Improvement |
|---|---|---|---|---|
| 2024 | $1,844 | $36,530 | $8,980 | $27,550 |
| 2023 | $1,844 | $36,530 | $8,980 | $27,550 |
| 2022 | $1,847 | $36,530 | $8,980 | $27,550 |
| 2021 | $1,936 | $33,860 | $6,910 | $26,950 |
| 2020 | $1,941 | $33,860 | $6,910 | $26,950 |
| 2019 | $1,973 | $33,860 | $6,910 | $26,950 |
| 2018 | $1,859 | $29,740 | $7,050 | $22,690 |
| 2017 | $1,731 | $31,959 | $7,049 | $24,910 |
| 2016 | $1,721 | $31,959 | $7,049 | $24,910 |
| 2015 | $1,714 | $31,336 | $6,913 | $24,423 |
| 2014 | $1,700 | $31,336 | $6,913 | $24,423 |
| 2013 | $1,798 | $31,336 | $6,913 | $24,423 |
Source: Public Records
Map
Nearby Homes
- 1101 Cambridge Ct Unit 1103
- 210 Zimmerman St
- 224 Orth Dr
- 315 Fenwick Dr
- 907 White Pine St
- 514 W Jefferson St
- 222 Rawson Dr
- 225 Prentice Dr
- 202 Fenwick Dr
- 312 Jefferson St
- 1207 N Scott St
- 1204 N Scott St
- 1211 N Scott St
- 201 Monroe Way
- Palmetto Plan at Monroe Meadows
- Cooper Plan at Monroe Meadows
- Norway Plan at Monroe Meadows
- Chestnut Plan at Monroe Meadows
- Bradford Plan at Monroe Meadows
- Spruce Plan at Monroe Meadows
- 1113 Edgebrook Ave
- 1111 Edgebrook Dr
- 1115 Edgebrook Dr
- 1119 Cambridge Ct Unit 1121
- 1123 Cambridge Ct Unit 1125
- 1109 Edgebrook Dr
- 1117 Edgebrook Dr
- 1110 Edgebrook Dr
- 1112 Edgebrook Dr
- 1108 Edgebrook Dr
- 301 Sunset Dr Unit 303
- 1106 Edgebrook Dr
- 1130 Cambridge Ct
- 1116 Edgebrook Dr
- 1128 Cambridge Ct Unit 1130
- 1126 Edgebrook Dr
- 1124 Edgebrook Dr
- 1119 Edgebrook Dr
- 516 Hamilton Ave
- 1104 Edgebrook Dr