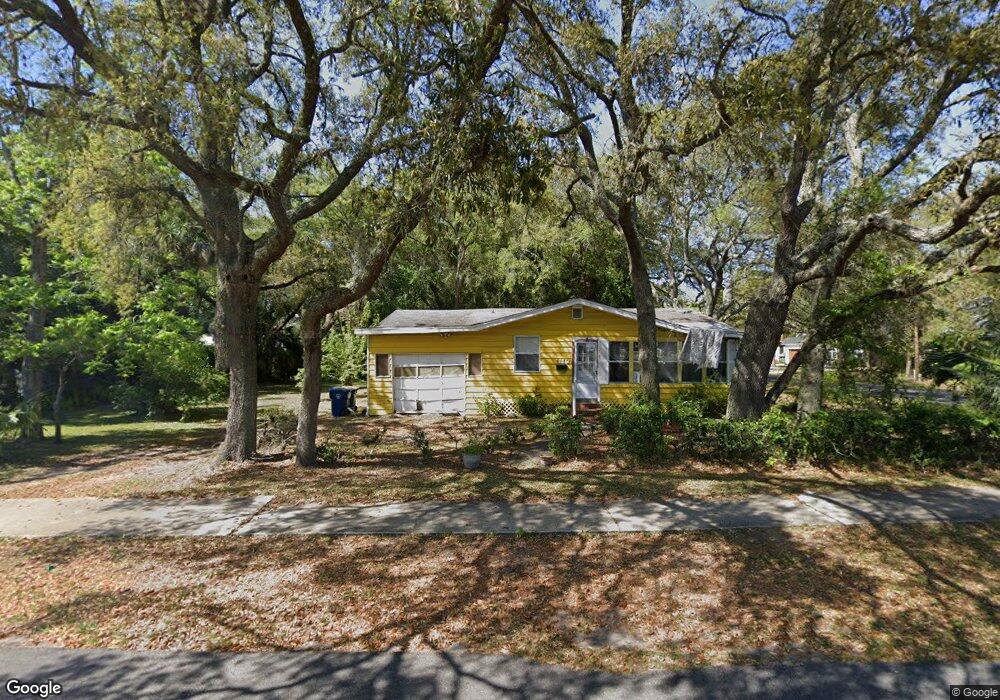
1113 Hickory St Fernandina Beach, FL 32034
Estimated Value: $279,987 - $413,000
3
Beds
1
Bath
1,274
Sq Ft
$283/Sq Ft
Est. Value
About This Home
This home is located at 1113 Hickory St, Fernandina Beach, FL 32034 and is currently estimated at $360,247, approximately $282 per square foot. 1113 Hickory St is a home located in Nassau County with nearby schools including Southside Elementary School, Emma Love Hardee Elementary School, and Fernandina Beach Middle School.
Ownership History
Date
Name
Owned For
Owner Type
Purchase Details
Closed on
Dec 10, 2020
Sold by
Harrison Green J and Harrison Lessie
Bought by
River Green Estates Llc
Current Estimated Value
Purchase Details
Closed on
Oct 17, 2014
Sold by
Green J C and Estate Of Robert Green
Bought by
Green J C and Harrison Lessie
Purchase Details
Closed on
Jul 7, 2005
Sold by
Boyd Denise B
Bought by
Estate Of Robert Green
Purchase Details
Closed on
Jul 16, 2001
Sold by
Boyd Denise B and Estate Of Robert Green
Bought by
Boyd Denise B
Create a Home Valuation Report for This Property
The Home Valuation Report is an in-depth analysis detailing your home's value as well as a comparison with similar homes in the area
Home Values in the Area
Average Home Value in this Area
Purchase History
| Date | Buyer | Sale Price | Title Company |
|---|---|---|---|
| River Green Estates Llc | $230,000 | Attorney | |
| Green J C | -- | Attorney | |
| Estate Of Robert Green | -- | -- | |
| Boyd Denise B | -- | -- |
Source: Public Records
Tax History Compared to Growth
Tax History
| Year | Tax Paid | Tax Assessment Tax Assessment Total Assessment is a certain percentage of the fair market value that is determined by local assessors to be the total taxable value of land and additions on the property. | Land | Improvement |
|---|---|---|---|---|
| 2024 | $2,251 | $150,210 | $110,000 | $40,210 |
| 2023 | $2,251 | $138,587 | $100,000 | $38,587 |
| 2022 | $1,937 | $118,094 | $80,000 | $38,094 |
| 2021 | $1,727 | $90,851 | $60,000 | $30,851 |
| 2020 | $2,416 | $132,555 | $50,000 | $82,555 |
| 2019 | $2,302 | $117,802 | $35,000 | $82,802 |
| 2018 | $2,017 | $99,233 | $0 | $0 |
| 2017 | $1,877 | $94,189 | $0 | $0 |
| 2016 | $1,737 | $85,815 | $0 | $0 |
| 2015 | $1,661 | $81,002 | $0 | $0 |
| 2014 | $1,422 | $65,528 | $0 | $0 |
Source: Public Records
Map
Nearby Homes