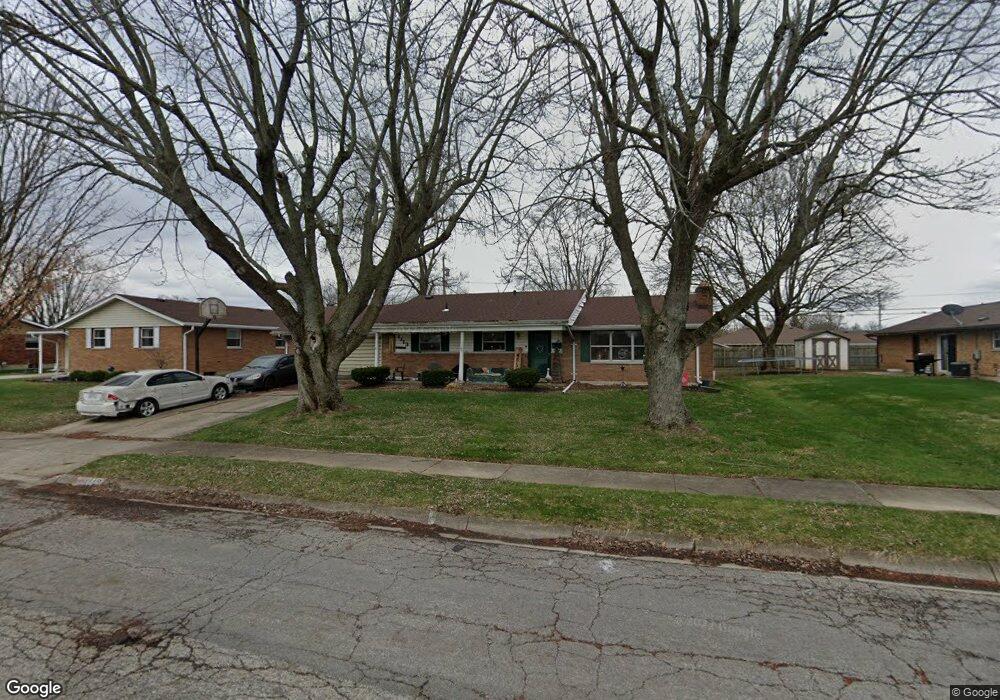
1113 Imperial Blvd Springfield, OH 45503
Estimated Value: $226,348 - $267,000
3
Beds
1
Bath
1,679
Sq Ft
$146/Sq Ft
Est. Value
About This Home
This home is located at 1113 Imperial Blvd, Springfield, OH 45503 and is currently estimated at $245,087, approximately $145 per square foot. 1113 Imperial Blvd is a home located in Clark County with nearby schools including Kenton Elementary School, Roosevelt Middle School, and Springfield High School.
Ownership History
Date
Name
Owned For
Owner Type
Purchase Details
Closed on
Jan 12, 1995
Sold by
Ball Donald R
Bought by
Elliott Michele A
Current Estimated Value
Home Financials for this Owner
Home Financials are based on the most recent Mortgage that was taken out on this home.
Original Mortgage
$76,000
Interest Rate
7.38%
Mortgage Type
New Conventional
Purchase Details
Closed on
Apr 17, 1992
Create a Home Valuation Report for This Property
The Home Valuation Report is an in-depth analysis detailing your home's value as well as a comparison with similar homes in the area
Home Values in the Area
Average Home Value in this Area
Purchase History
| Date | Buyer | Sale Price | Title Company |
|---|---|---|---|
| Elliott Michele A | $91,000 | -- | |
| -- | $83,000 | -- |
Source: Public Records
Mortgage History
| Date | Status | Borrower | Loan Amount |
|---|---|---|---|
| Closed | Elliott Michele A | $76,000 |
Source: Public Records
Tax History
| Year | Tax Paid | Tax Assessment Tax Assessment Total Assessment is a certain percentage of the fair market value that is determined by local assessors to be the total taxable value of land and additions on the property. | Land | Improvement |
|---|---|---|---|---|
| 2025 | $2,508 | $69,720 | $11,620 | $58,100 |
| 2024 | $2,443 | $50,690 | $10,630 | $40,060 |
| 2023 | $2,443 | $50,690 | $10,630 | $40,060 |
| 2022 | $2,502 | $50,690 | $10,630 | $40,060 |
| 2021 | $2,432 | $45,410 | $8,300 | $37,110 |
| 2020 | $2,438 | $45,410 | $8,300 | $37,110 |
| 2019 | $2,444 | $45,410 | $8,300 | $37,110 |
| 2018 | $2,242 | $40,090 | $9,130 | $30,960 |
| 2017 | $2,241 | $41,997 | $9,132 | $32,865 |
| 2016 | $2,243 | $41,997 | $9,132 | $32,865 |
| 2015 | $2,076 | $38,749 | $8,302 | $30,447 |
| 2014 | $2,067 | $38,749 | $8,302 | $30,447 |
| 2013 | $2,045 | $38,749 | $8,302 | $30,447 |
Source: Public Records
Map
Nearby Homes
- 3124 El Camino Dr
- 1225 Vester Ave
- 2553 Derr Rd
- 1516 Hyannis Dr
- 3135 Imperial Blvd
- 2439 Greystone Ln
- 2824 Balsam Dr
- 1315 Greystone Dr
- 1323 Greystone Dr
- 615 Villa Rd Unit K
- 1032 Armsgate Rd
- 3153 Argonne Ln N
- 3250 Argonne Ln N
- 3247 Argonne Ln N Unit 3247
- 1924 Marinette Dr
- 1811 Devon Dr
- 2153 Olympic St Unit 2153
- 1040 Carson Ln
- 2951 Archer Ln
- 1139 Bradford Dr
- 1123 Imperial Blvd
- 2824 Home Orchard Dr
- 1126 Torrence Dr
- 1134 Torrence Dr
- 1116 Torrence Dr
- 1133 Imperial Blvd
- 2905 Malibu St
- 2904 Malibu St
- 1200 Torrence Dr
- 1201 Imperial Blvd
- 2823 Home Orchard Dr
- 1024 Torrence Dr
- 1210 Torrence Dr
- 1125 Torrence Dr
- 1135 Torrence Dr
- 2686 Home Orchard Dr
- 1200 Imperial Blvd
- 2915 Malibu St
- 2914 Malibu St
- 1211 Imperial Blvd
Your Personal Tour Guide
Ask me questions while you tour the home.