Estimated Value: $349,005 - $375,000
4
Beds
2
Baths
1,762
Sq Ft
$206/Sq Ft
Est. Value
About This Home
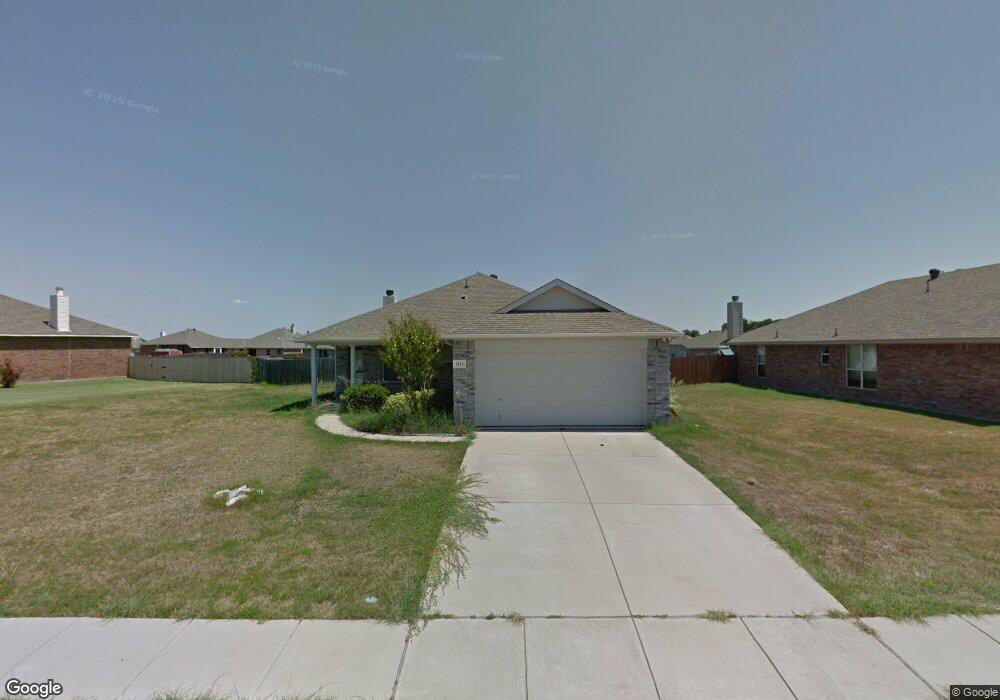
This home is located at 1113 Lake Whitney Dr, Wylie, TX 75098 and is currently estimated at $363,251, approximately $206 per square foot. 1113 Lake Whitney Dr is a home located in Collin County with nearby schools including Wally Watkins Elementary School, AB Harrison Intermediate School, and Grady Burnett J High School.
Ownership History
Date
Name
Owned For
Owner Type
Purchase Details
Closed on
Nov 3, 2015
Sold by
Freo Texas Llc
Bought by
Progress Residential 2015-3 Borrower Llc
Current Estimated Value
Home Financials for this Owner
Home Financials are based on the most recent Mortgage that was taken out on this home.
Original Mortgage
$449,713,000
Outstanding Balance
$353,099,468
Interest Rate
3.9%
Mortgage Type
Purchase Money Mortgage
Estimated Equity
-$352,736,217
Purchase Details
Closed on
Sep 22, 2014
Sold by
Rozell James Baron and Floyd Sarah A
Bought by
Freo Texas Llc
Purchase Details
Closed on
Mar 28, 2006
Sold by
Choice Homes Inc
Bought by
Rozell James Baron and Floyd Sarah A
Home Financials for this Owner
Home Financials are based on the most recent Mortgage that was taken out on this home.
Original Mortgage
$155,853
Interest Rate
6.21%
Mortgage Type
FHA
Create a Home Valuation Report for This Property
The Home Valuation Report is an in-depth analysis detailing your home's value as well as a comparison with similar homes in the area
Home Values in the Area
Average Home Value in this Area
Purchase History
| Date | Buyer | Sale Price | Title Company |
|---|---|---|---|
| Progress Residential 2015-3 Borrower Llc | -- | Attorney | |
| Freo Texas Llc | $144,000 | None Available | |
| Rozell James Baron | -- | Fnt |
Source: Public Records
Mortgage History
| Date | Status | Borrower | Loan Amount |
|---|---|---|---|
| Open | Progress Residential 2015-3 Borrower Llc | $449,713,000 | |
| Previous Owner | Rozell James Baron | $155,853 |
Source: Public Records
Tax History Compared to Growth
Tax History
| Year | Tax Paid | Tax Assessment Tax Assessment Total Assessment is a certain percentage of the fair market value that is determined by local assessors to be the total taxable value of land and additions on the property. | Land | Improvement |
|---|---|---|---|---|
| 2025 | $7,239 | $394,649 | $90,000 | $304,649 |
| 2024 | $7,239 | $375,429 | $80,000 | $295,429 |
| 2023 | $7,239 | $369,622 | $80,000 | $289,622 |
| 2022 | $7,388 | $336,750 | $80,000 | $256,750 |
| 2021 | $6,282 | $267,000 | $60,000 | $207,000 |
| 2020 | $5,986 | $241,074 | $60,000 | $181,074 |
| 2019 | $6,484 | $246,740 | $60,000 | $186,740 |
| 2018 | $6,288 | $233,471 | $50,000 | $183,471 |
| 2017 | $5,813 | $215,845 | $45,000 | $170,845 |
| 2016 | $5,200 | $187,137 | $33,000 | $154,137 |
| 2015 | $3,959 | $165,935 | $33,000 | $132,935 |
Source: Public Records
Map
Nearby Homes
- 314 Lake Texoma Dr
- 800 Twin Oaks Dr
- 226 Shadybrook Dr
- Oakhaven Plan at Alanis Crossing
- Valencia Plan at Alanis Crossing
- 203 Forestbrook Dr
- 1500 Northwood Dr
- 1306 Angel Fire Dr
- 109 Rockbrook Dr
- 217 Cloudcroft Dr
- 414 Briarwood Dr
- 103 Cascade Ln
- 1116 Bozman Rd
- 105 Dove Haven Dr
- 1210 Iron Horse St
- 212 Colonial Dr
- 407 Stoneybrook Dr
- 401 Willow Way
- 416 Dogwood Dr
- 416 S 1st St
- 1115 Lake Whitney Dr
- 1111 Lake Whitney Dr
- 1117 Lake Whitney Dr
- 1109 Lake Whitney Dr
- 1110 Lakewood Dr
- 1110 Lake Whitney Dr
- 1112 Lakewood Dr
- 1108 Lakewood Dr
- 1108 Lake Whitney Dr
- 1112 Lake Whitney Dr
- 1119 Lake Whitney Dr
- 1106 Lake Whitney Dr
- 1107 Lake Whitney Dr
- 1114 Lakewood Dr
- 1114 Lake Whitney Dr
- 1106 Lakewood Dr
- 1104 Lake Whitney Dr
- 1121 Lake Whitney Dr
- 1116 Lake Whitney Dr
- 1102 Lake Whitney Dr