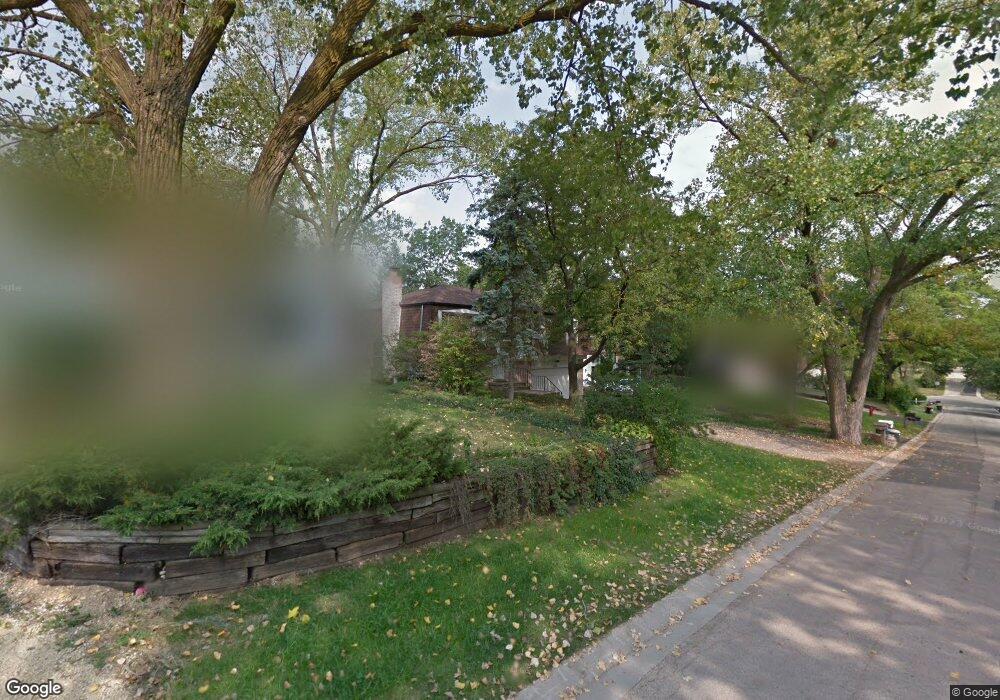
1113 Maple St Lake In the Hills, IL 60156
Estimated Value: $302,000 - $323,052
3
Beds
3
Baths
1,226
Sq Ft
$255/Sq Ft
Est. Value
About This Home
This home is located at 1113 Maple St, Lake In the Hills, IL 60156 and is currently estimated at $312,513, approximately $254 per square foot. 1113 Maple St is a home located in McHenry County with nearby schools including Westfield Community School, Lake in the Hills Elementary School, and Harry D Jacobs High School.
Ownership History
Date
Name
Owned For
Owner Type
Purchase Details
Closed on
Sep 18, 2009
Sold by
Goforth Carroll W and Goforth Rosita G
Bought by
Staron Marc and Pratt Jillian
Current Estimated Value
Home Financials for this Owner
Home Financials are based on the most recent Mortgage that was taken out on this home.
Original Mortgage
$150,228
Interest Rate
5.11%
Mortgage Type
FHA
Purchase Details
Closed on
Jul 30, 1997
Sold by
White P Diane and White Phyllis D
Bought by
Goforth Carroll W and Goforth Rosita G
Home Financials for this Owner
Home Financials are based on the most recent Mortgage that was taken out on this home.
Original Mortgage
$120,143
Interest Rate
7.71%
Mortgage Type
FHA
Purchase Details
Closed on
Nov 19, 1993
Sold by
White Michael L
Bought by
White Phyllis D
Create a Home Valuation Report for This Property
The Home Valuation Report is an in-depth analysis detailing your home's value as well as a comparison with similar homes in the area
Home Values in the Area
Average Home Value in this Area
Purchase History
| Date | Buyer | Sale Price | Title Company |
|---|---|---|---|
| Staron Marc | $153,000 | Baird & Warner Title Service | |
| Goforth Carroll W | $127,500 | Chicago Title | |
| White Phyllis D | -- | -- |
Source: Public Records
Mortgage History
| Date | Status | Borrower | Loan Amount |
|---|---|---|---|
| Previous Owner | Staron Marc | $150,228 | |
| Previous Owner | Goforth Carroll W | $120,143 |
Source: Public Records
Tax History Compared to Growth
Tax History
| Year | Tax Paid | Tax Assessment Tax Assessment Total Assessment is a certain percentage of the fair market value that is determined by local assessors to be the total taxable value of land and additions on the property. | Land | Improvement |
|---|---|---|---|---|
| 2024 | $6,974 | $96,056 | $10,037 | $86,019 |
| 2023 | $6,621 | $85,910 | $8,977 | $76,933 |
| 2022 | $6,445 | $79,576 | $8,102 | $71,474 |
| 2021 | $6,189 | $74,135 | $7,548 | $66,587 |
| 2020 | $6,031 | $71,511 | $7,281 | $64,230 |
| 2019 | $5,886 | $68,445 | $6,969 | $61,476 |
| 2018 | $5,095 | $57,877 | $13,927 | $43,950 |
| 2017 | $4,936 | $54,524 | $13,120 | $41,404 |
| 2016 | $4,848 | $51,138 | $12,305 | $38,833 |
| 2013 | -- | $51,301 | $11,479 | $39,822 |
Source: Public Records
Map
Nearby Homes
- 1114 Ash St
- 70 Hilltop Dr Unit 4
- 215 Indian Trail
- 1049 Horizon Ridge
- 992 Mcphee Dr
- 1345 Cunat Ct Unit 1B
- 1345 Cunat Ct Unit 2D
- 275 Indian Trail
- 1354 Cunat Ct Unit 3G
- 338 Hiawatha Dr
- Lots 10 & 11 Ramble Rd
- LOT 3 Blackhawk Dr
- 113 Pheasant Trail
- 101 Oakleaf Rd
- 900 Windstone Ct
- 212 Village Creek Dr
- 10 Lincoln St
- 807 Menominee Dr
- 809 Menominee Dr
- 135 Arquilla Dr