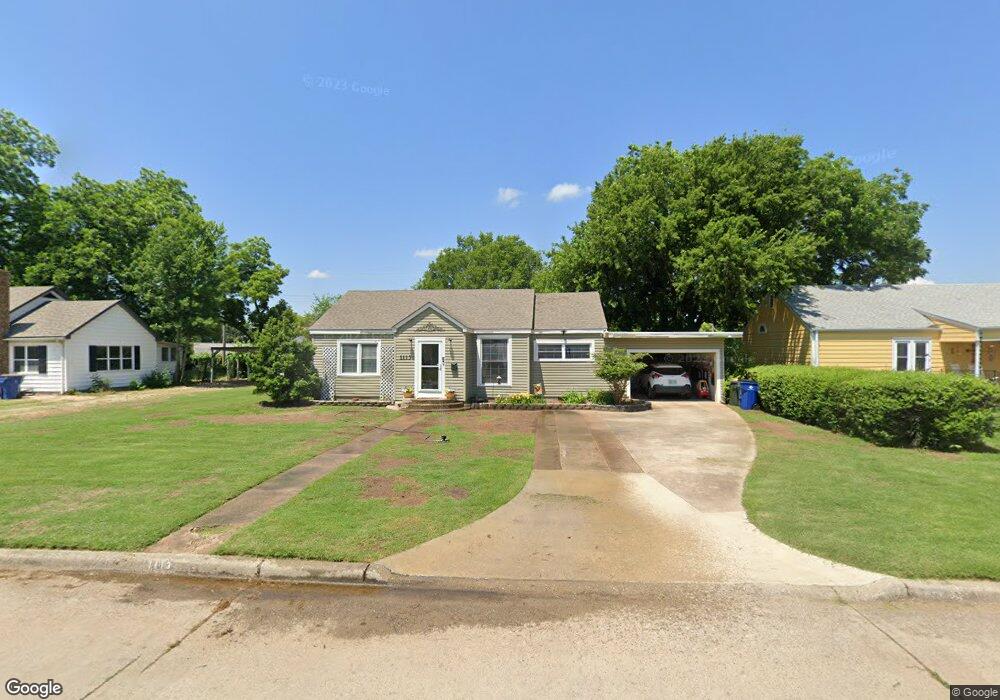
1113 N 13th St Duncan, OK 73533
Estimated Value: $119,575 - $149,000
2
Beds
1
Bath
1,530
Sq Ft
$88/Sq Ft
Est. Value
About This Home
This home is located at 1113 N 13th St, Duncan, OK 73533 and is currently estimated at $134,394, approximately $87 per square foot. 1113 N 13th St is a home located in Stephens County with nearby schools including Emerson Elementary School, Duncan Middle School, and Duncan High School.
Ownership History
Date
Name
Owned For
Owner Type
Purchase Details
Closed on
Jun 13, 2023
Sold by
Cole Robert Clay and Cole Janet Lynn
Bought by
Cole Family Trust
Current Estimated Value
Purchase Details
Closed on
Sep 30, 2014
Sold by
Mcroy Chad E and Mcroy Maria
Bought by
Cole Robert Clay and Cole Janet L
Home Financials for this Owner
Home Financials are based on the most recent Mortgage that was taken out on this home.
Original Mortgage
$66,000
Interest Rate
4.1%
Mortgage Type
New Conventional
Purchase Details
Closed on
Jun 30, 2005
Sold by
Perkins Grant K
Bought by
Mcroy Chad E
Home Financials for this Owner
Home Financials are based on the most recent Mortgage that was taken out on this home.
Original Mortgage
$59,221
Interest Rate
5.67%
Mortgage Type
New Conventional
Purchase Details
Closed on
Dec 6, 2003
Sold by
Walker Sylvia and Walker Richard
Purchase Details
Closed on
May 2, 2000
Sold by
Walker Sylvia and Walker Richard
Create a Home Valuation Report for This Property
The Home Valuation Report is an in-depth analysis detailing your home's value as well as a comparison with similar homes in the area
Home Values in the Area
Average Home Value in this Area
Purchase History
| Date | Buyer | Sale Price | Title Company |
|---|---|---|---|
| Cole Family Trust | -- | None Listed On Document | |
| Cole Robert Clay | $82,500 | None Available | |
| Mcroy Chad E | $58,000 | Stewart Escrow & Title | |
| -- | $35,000 | -- | |
| -- | -- | -- |
Source: Public Records
Mortgage History
| Date | Status | Borrower | Loan Amount |
|---|---|---|---|
| Previous Owner | Cole Robert Clay | $66,000 | |
| Previous Owner | Mcroy Chad E | $59,221 |
Source: Public Records
Tax History Compared to Growth
Tax History
| Year | Tax Paid | Tax Assessment Tax Assessment Total Assessment is a certain percentage of the fair market value that is determined by local assessors to be the total taxable value of land and additions on the property. | Land | Improvement |
|---|---|---|---|---|
| 2025 | $889 | $10,948 | $1,076 | $9,872 |
| 2024 | $889 | $10,434 | $1,076 | $9,358 |
| 2023 | $889 | $10,091 | $1,076 | $9,015 |
| 2022 | $805 | $9,938 | $1,076 | $8,862 |
| 2021 | $806 | $9,465 | $1,076 | $8,389 |
| 2020 | $741 | $8,585 | $1,076 | $7,509 |
| 2019 | $722 | $8,342 | $1,076 | $7,266 |
| 2018 | $802 | $9,003 | $1,076 | $7,927 |
| 2017 | $794 | $9,234 | $1,076 | $8,158 |
| 2016 | $778 | $9,154 | $1,076 | $8,078 |
| 2015 | $639 | $9,154 | $1,076 | $8,078 |
| 2014 | $639 | $8,558 | $1,076 | $7,482 |
Source: Public Records
Map
Nearby Homes
- 1114 N 13th St
- 1105 1105 N Grand Ave
- 1202 N Grand Blvd
- 1112 1112 N 12th
- 815 N 14th St
- 812 N 15th St
- 1112 W Spruce St
- 810 810 N 12th St
- 1001 1001 W Hackberry
- 1213 W Pine Ave
- 1807 W Chisholm Dr
- 1412 N 12th St
- 1402 1402 W Elk Ave
- 1099 1099 N 19th St
- 1902 W Randall Ave
- 1444 1444 N 8th St
- 1508 1508 N 13th St
- 1405 Evergreen Dr
- 1312 Pkwy
- 1107 W Elk Ave
- 1115 N 13th St
- 1111 N 13th St
- 1117 N 13th St
- 1107 N 13th St
- 1116 N 13th St
- 1120 N 13th St
- 1122 N 13th St
- 1112 N 13th St
- 1309 W Elder Ave
- 1119 N 13th St
- 1105 N 13th St
- 1110 N 13th St
- 1124 N 13th St
- 1108 N 13th St
- 1103 N 13th St
- 1201 N 13th St
- 1305 1305 W Elder Ave
- 1117 N Grand Blvd
- 1115 N Grand Blvd
- 1119 N Grand Blvd