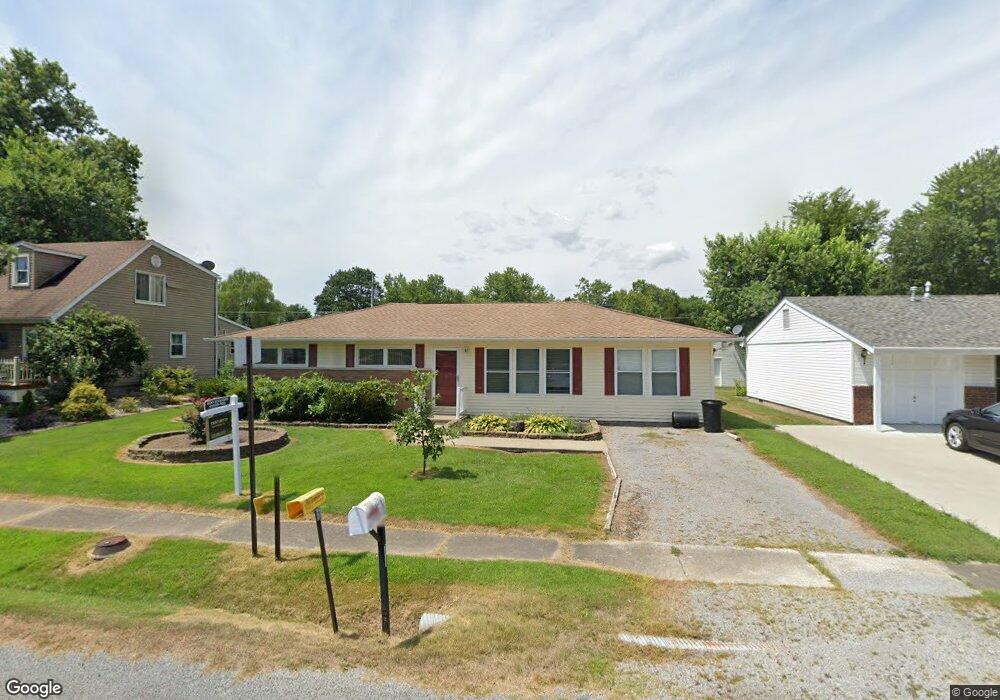
1113 N 7th St Herrin, IL 62948
Estimated Value: $125,000 - $140,000
--
Bed
--
Bath
1,304
Sq Ft
$102/Sq Ft
Est. Value
About This Home
This home is located at 1113 N 7th St, Herrin, IL 62948 and is currently estimated at $133,557, approximately $102 per square foot. 1113 N 7th St is a home located in Williamson County with nearby schools including North Side Primary Center, Herrin Community Elementary School, and Herrin Middle School.
Ownership History
Date
Name
Owned For
Owner Type
Purchase Details
Closed on
Jun 29, 2020
Sold by
Robin Chitwood
Bought by
Brown Teandre Ca
Current Estimated Value
Home Financials for this Owner
Home Financials are based on the most recent Mortgage that was taken out on this home.
Original Mortgage
$87,606
Outstanding Balance
$77,827
Interest Rate
3.2%
Mortgage Type
New Conventional
Estimated Equity
$55,730
Create a Home Valuation Report for This Property
The Home Valuation Report is an in-depth analysis detailing your home's value as well as a comparison with similar homes in the area
Home Values in the Area
Average Home Value in this Area
Purchase History
| Date | Buyer | Sale Price | Title Company |
|---|---|---|---|
| Brown Teandre Ca | $88,000 | Mayberry Brandon C |
Source: Public Records
Mortgage History
| Date | Status | Borrower | Loan Amount |
|---|---|---|---|
| Open | Brown Teandre Ca | $87,606 |
Source: Public Records
Tax History Compared to Growth
Tax History
| Year | Tax Paid | Tax Assessment Tax Assessment Total Assessment is a certain percentage of the fair market value that is determined by local assessors to be the total taxable value of land and additions on the property. | Land | Improvement |
|---|---|---|---|---|
| 2025 | $2,384 | $33,240 | $4,260 | $28,980 |
| 2024 | $2,384 | $33,240 | $4,260 | $28,980 |
| 2023 | $2,384 | $33,240 | $4,260 | $28,980 |
| 2022 | $2,504 | $29,280 | $3,750 | $25,530 |
| 2021 | $2,435 | $28,220 | $3,610 | $24,610 |
| 2020 | $2,435 | $26,660 | $3,410 | $23,250 |
| 2019 | $2,265 | $26,660 | $3,410 | $23,250 |
| 2018 | $2,265 | $26,660 | $3,410 | $23,250 |
| 2017 | $1,301 | $26,660 | $3,410 | $23,250 |
| 2015 | $1,229 | $25,250 | $3,230 | $22,020 |
| 2013 | $1,005 | $25,250 | $3,230 | $22,020 |
| 2012 | $1,005 | $25,250 | $3,230 | $22,020 |
Source: Public Records
Map
Nearby Homes