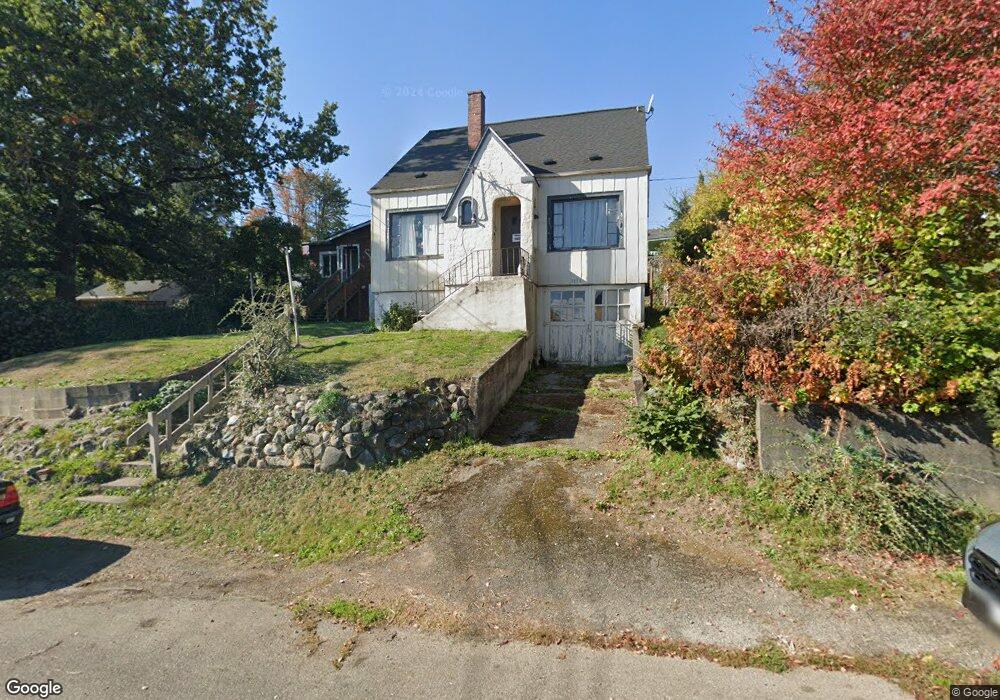
1113 N Cambrian Ave Bremerton, WA 98312
Estimated Value: $478,000 - $561,000
4
Beds
1
Bath
1,500
Sq Ft
$340/Sq Ft
Est. Value
About This Home
This home is located at 1113 N Cambrian Ave, Bremerton, WA 98312 and is currently estimated at $510,600, approximately $340 per square foot. 1113 N Cambrian Ave is a home located in Kitsap County with nearby schools including Crownhill Elementary School, Mountain View Middle School, and Bremerton High School.
Ownership History
Date
Name
Owned For
Owner Type
Purchase Details
Closed on
Sep 2, 2020
Sold by
Karlik Bradley C and Karlik Bradley C
Bought by
Karlik Bradley C and Westlake Patrick W
Current Estimated Value
Home Financials for this Owner
Home Financials are based on the most recent Mortgage that was taken out on this home.
Original Mortgage
$155,500
Outstanding Balance
$137,996
Interest Rate
2.9%
Mortgage Type
New Conventional
Estimated Equity
$372,604
Purchase Details
Closed on
Nov 27, 2002
Sold by
Cook Lee C and Cook Marvelyn K
Bought by
Rogers William E and Rogers Deonne R
Purchase Details
Closed on
Jan 22, 2002
Sold by
Rogers William E and Rogers Deonne R
Bought by
Karlick Brad C
Home Financials for this Owner
Home Financials are based on the most recent Mortgage that was taken out on this home.
Original Mortgage
$140,800
Interest Rate
5.96%
Mortgage Type
Purchase Money Mortgage
Create a Home Valuation Report for This Property
The Home Valuation Report is an in-depth analysis detailing your home's value as well as a comparison with similar homes in the area
Home Values in the Area
Average Home Value in this Area
Purchase History
| Date | Buyer | Sale Price | Title Company |
|---|---|---|---|
| Karlik Bradley C | -- | Fidelity National Title | |
| Rogers William E | -- | Land Title Company | |
| Karlick Brad C | $176,000 | Land Title Company |
Source: Public Records
Mortgage History
| Date | Status | Borrower | Loan Amount |
|---|---|---|---|
| Open | Karlik Bradley C | $155,500 | |
| Previous Owner | Karlick Brad C | $140,800 | |
| Closed | Karlick Brad C | $17,600 |
Source: Public Records
Tax History Compared to Growth
Tax History
| Year | Tax Paid | Tax Assessment Tax Assessment Total Assessment is a certain percentage of the fair market value that is determined by local assessors to be the total taxable value of land and additions on the property. | Land | Improvement |
|---|---|---|---|---|
| 2026 | $4,843 | $549,010 | $89,760 | $459,250 |
| 2025 | $4,843 | $549,010 | $89,760 | $459,250 |
| 2024 | $4,673 | $549,010 | $89,760 | $459,250 |
| 2023 | $4,830 | $549,010 | $89,760 | $459,250 |
| 2022 | $4,485 | $458,320 | $74,800 | $383,520 |
| 2021 | $4,378 | $409,500 | $56,220 | $353,280 |
| 2020 | $4,068 | $380,140 | $52,030 | $328,110 |
| 2019 | $3,511 | $340,000 | $46,440 | $293,560 |
| 2018 | $3,494 | $221,540 | $34,920 | $186,620 |
| 2017 | $2,900 | $221,540 | $34,920 | $186,620 |
| 2016 | $2,732 | $197,520 | $30,630 | $166,890 |
| 2015 | $2,870 | $206,440 | $33,310 | $173,130 |
| 2014 | -- | $195,790 | $33,310 | $162,480 |
| 2013 | -- | $209,220 | $35,160 | $174,060 |
Source: Public Records
Map
Nearby Homes
- 1309 Times Ave
- 1303 Times Ave
- 1146 N Callow Ave
- 603 N Summit Ave
- 2311 8th St
- 1135 Morgan Rd NW Unit A & B
- 3201 17th St
- 1551 N Callow Ave
- 320 N Lafayette Ave
- 1720 N Wycoff Ave
- 10xx Naval Ave
- 10 XX Naval Ave
- 138 N Rainier Ave
- 2135 4th St
- 107 N Callow Ave
- 931 Oyster Bay Ct
- 1325 Marguerite Ave
- 1910 11th St
- 114 S Lafayette Ave
- 1140 Lower Marine Dr
- 1111 Cambrian Ave
- 1117 N Cambrian Ave
- 1101 N Cambrian Ave
- 1108 N Lafayette Ave
- 1112 N Lafayette Ave
- 1106 N Lafayette Ave
- 1121 N Cambrian Ave
- 1108 N Cambrian Ave
- 1116 N Lafayette Ave
- 1112 N Cambrian Ave
- 1102 N Lafayette Ave
- 1104 N Cambrian Ave
- 1102 N Cambrian Ave
- 1114 N Cambrian Ave
- 1122 N Lafayette Ave
- 1123 N Cambrian Ave
- 1116 N Cambrian Ave
- 1129 N Lafayette Ave
- 1103 1103 1/2 N Wycoff Ave
- 1103 N Wycoff Ave