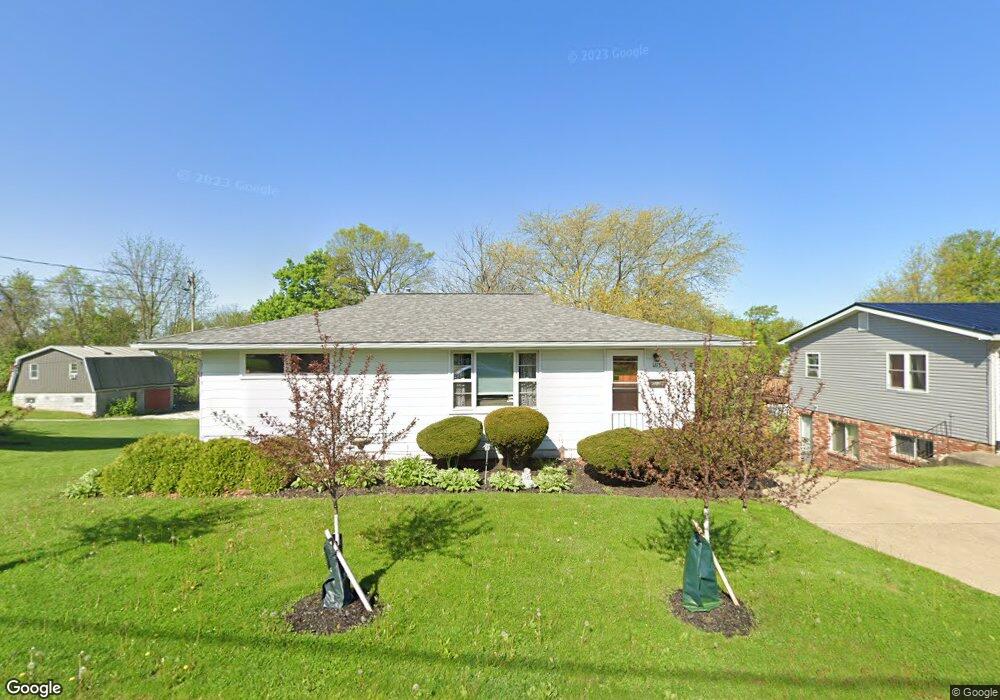
1113 N Mulberry St Mount Vernon, OH 43050
Estimated Value: $175,048 - $206,000
3
Beds
1
Bath
1,064
Sq Ft
$180/Sq Ft
Est. Value
About This Home
This home is located at 1113 N Mulberry St, Mount Vernon, OH 43050 and is currently estimated at $191,012, approximately $179 per square foot. 1113 N Mulberry St is a home located in Knox County with nearby schools including Mount Vernon High School, St. Vincent de Paul School, and Christian Star Academy.
Ownership History
Date
Name
Owned For
Owner Type
Purchase Details
Closed on
Nov 20, 2009
Sold by
Allen Toni J and Allen Toni
Bought by
Smith Jason A
Current Estimated Value
Home Financials for this Owner
Home Financials are based on the most recent Mortgage that was taken out on this home.
Original Mortgage
$2,550
Outstanding Balance
$1,669
Interest Rate
5.05%
Mortgage Type
Stand Alone Second
Estimated Equity
$189,343
Purchase Details
Closed on
May 17, 2007
Sold by
Elder Bette A and Cordrey Deborah
Bought by
Allen Toni and Cordrey Michael
Create a Home Valuation Report for This Property
The Home Valuation Report is an in-depth analysis detailing your home's value as well as a comparison with similar homes in the area
Home Values in the Area
Average Home Value in this Area
Purchase History
| Date | Buyer | Sale Price | Title Company |
|---|---|---|---|
| Smith Jason A | $63,750 | None Available | |
| Allen Toni | $45,000 | None Available |
Source: Public Records
Mortgage History
| Date | Status | Borrower | Loan Amount |
|---|---|---|---|
| Open | Smith Jason A | $2,550 | |
| Open | Smith Jason A | $83,460 |
Source: Public Records
Tax History Compared to Growth
Tax History
| Year | Tax Paid | Tax Assessment Tax Assessment Total Assessment is a certain percentage of the fair market value that is determined by local assessors to be the total taxable value of land and additions on the property. | Land | Improvement |
|---|---|---|---|---|
| 2024 | $1,398 | $36,230 | $7,410 | $28,820 |
| 2023 | $1,398 | $36,230 | $7,410 | $28,820 |
| 2022 | $1,132 | $26,640 | $5,450 | $21,190 |
| 2021 | $1,132 | $26,640 | $5,450 | $21,190 |
| 2020 | $1,103 | $26,640 | $5,450 | $21,190 |
| 2019 | $1,176 | $26,500 | $6,950 | $19,550 |
| 2018 | $1,176 | $26,500 | $6,950 | $19,550 |
| 2017 | $1,155 | $26,500 | $6,950 | $19,550 |
| 2016 | $1,072 | $24,550 | $6,440 | $18,110 |
| 2015 | $1,077 | $24,550 | $6,440 | $18,110 |
| 2014 | $1,082 | $24,550 | $6,440 | $18,110 |
| 2013 | $1,067 | $22,980 | $6,050 | $16,930 |
Source: Public Records
Map
Nearby Homes
- 1111 N Mulberry St
- 1109 N Mulberry St
- 1117 N Mulberry St
- 1112 N Mulberry St
- 1110 N Mulberry St
- 1114 N Mulberry St
- 1108 N Mulberry St
- 1116 N Mulberry St
- 1119 N Mulberry St
- 1106 N Mulberry St
- 1107 N Mulberry St
- 1118 N Mulberry St
- 8 Belmont Ave
- 1104 N Mulberry St
- 10 Belmont Ave
- 302 Prospect Extension
- 6 Belmont Ave
- 1105 N Mulberry St
- 1122 N Mulberry St
- 12 Belmont Ave