Estimated Value: $112,397 - $139,000
--
Bed
1
Bath
1,337
Sq Ft
$94/Sq Ft
Est. Value
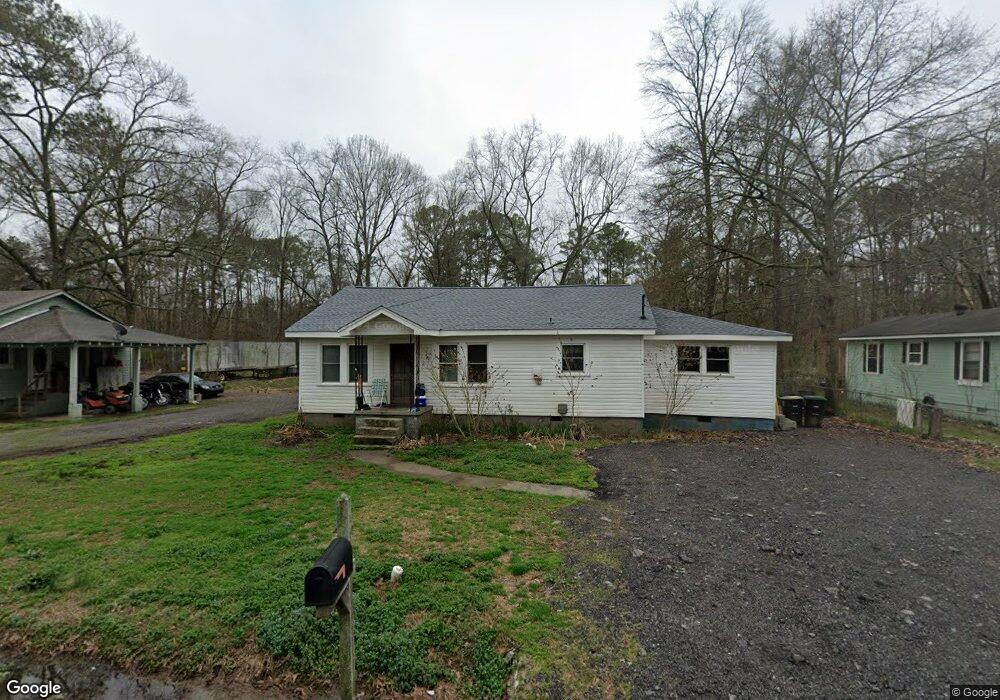
About This Home
This home is located at 1113 Oakland Ave SW, Rome, GA 30165 and is currently estimated at $125,599, approximately $93 per square foot. 1113 Oakland Ave SW is a home located in Floyd County with nearby schools including Rome High School and St. Mary School.
Ownership History
Date
Name
Owned For
Owner Type
Purchase Details
Closed on
Nov 10, 2010
Sold by
Tanner Shonna K
Bought by
Tanner James I
Current Estimated Value
Purchase Details
Closed on
Sep 10, 2010
Bought by
P and R
Purchase Details
Closed on
Jun 25, 1998
Sold by
Miller Virgil G and Miller Lily
Bought by
Tanner Ii James I and Tanner Shonna K
Purchase Details
Closed on
Apr 30, 1979
Sold by
Administrator Of Veterans Affairs
Bought by
Miller Virgil G and Miller Lily
Purchase Details
Closed on
Mar 2, 1978
Sold by
Foundation Mortgage Corporation
Bought by
Administrator Of Veterans Affairs
Purchase Details
Closed on
Aug 16, 1976
Sold by
Dodd Richard and Nancy Harless
Bought by
Morgan Bobby Edward
Purchase Details
Closed on
Apr 11, 1967
Sold by
Johnson James C
Bought by
Dodd Richard and Nancy Harless
Purchase Details
Closed on
Jan 1, 1901
Bought by
Johnson James C
Create a Home Valuation Report for This Property
The Home Valuation Report is an in-depth analysis detailing your home's value as well as a comparison with similar homes in the area
Home Values in the Area
Average Home Value in this Area
Purchase History
| Date | Buyer | Sale Price | Title Company |
|---|---|---|---|
| Tanner James I | -- | -- | |
| P | -- | -- | |
| Tanner Ii James I | $25,000 | -- | |
| Miller Virgil G | $16,900 | -- | |
| Administrator Of Veterans Affairs | -- | -- | |
| Foundation Mortgage Corporation | $18,000 | -- | |
| Morgan Bobby Edward | $17,900 | -- | |
| Dodd Richard | $115,500 | -- | |
| Johnson James C | -- | -- |
Source: Public Records
Tax History Compared to Growth
Tax History
| Year | Tax Paid | Tax Assessment Tax Assessment Total Assessment is a certain percentage of the fair market value that is determined by local assessors to be the total taxable value of land and additions on the property. | Land | Improvement |
|---|---|---|---|---|
| 2024 | $956 | $33,790 | $8,586 | $25,204 |
| 2023 | $867 | $29,020 | $7,632 | $21,388 |
| 2022 | $810 | $24,005 | $6,360 | $17,645 |
| 2021 | $773 | $22,133 | $6,360 | $15,773 |
| 2020 | $684 | $19,598 | $4,770 | $14,828 |
| 2019 | $643 | $18,654 | $4,770 | $13,884 |
| 2018 | $609 | $17,727 | $4,770 | $12,957 |
| 2017 | $588 | $17,163 | $4,770 | $12,393 |
| 2016 | $614 | $17,816 | $4,760 | $13,056 |
| 2015 | -- | $17,816 | $4,760 | $13,056 |
| 2014 | -- | $17,816 | $4,760 | $13,056 |
Source: Public Records
Map
Nearby Homes
- 50 Melton Ave SW
- 3 Pebble Bend Ct
- 110 Williamson St SW
- 8 Leon St SW
- 40 Paris Dr SW
- 16 Wilkerson Rd SW
- 103 Wooten Dr SW
- 8 S Hughes St SW
- 17 Wilkerson Rd SW
- 438 Wilkerson Rd SW
- 0 Mount Alto Rd SW Unit 10523740
- 3 Walker Dr SW
- 100 Dellwood Dr NW
- 13 Ridgewood Rd SW
- 4 Homestead Cir NW
- 506 Wilkerson Rd SW
- 40 Hawk Spring Dr SW
- 14 Berckman Ln SW
- 3 Berckman Ln SW
- 1115 Oakland Ave SW
- 1115 Oakland Ave SW
- 1111 Oakland Ave SW
- 1109 Oakland Ave SW
- 1107 Oakland Ave SW
- 1116 Oakland Ave SW
- 1112 Oakland Ave SW
- 1112 Oakland Ave SW
- 1118 Oakland Ave SW
- 1120 Oakland Ave SW Unit I13L 190
- 1120 Oakland Ave SW
- 0 Oakland Ave SW Unit 7034266
- 0 Oakland Ave SW Unit 8209967
- 0 Oakland Ave SW Unit 8100910
- 0 Oakland Ave SW Unit 7583462
- 0 Oakland Ave SW Unit 8518080
- 0 Oakland Ave SW Unit 8476682
- 0 Oakland Ave SW Unit 7563900
- 0 Oakland Ave SW Unit 2927471
- 0 Oakland Ave SW Unit 3158036