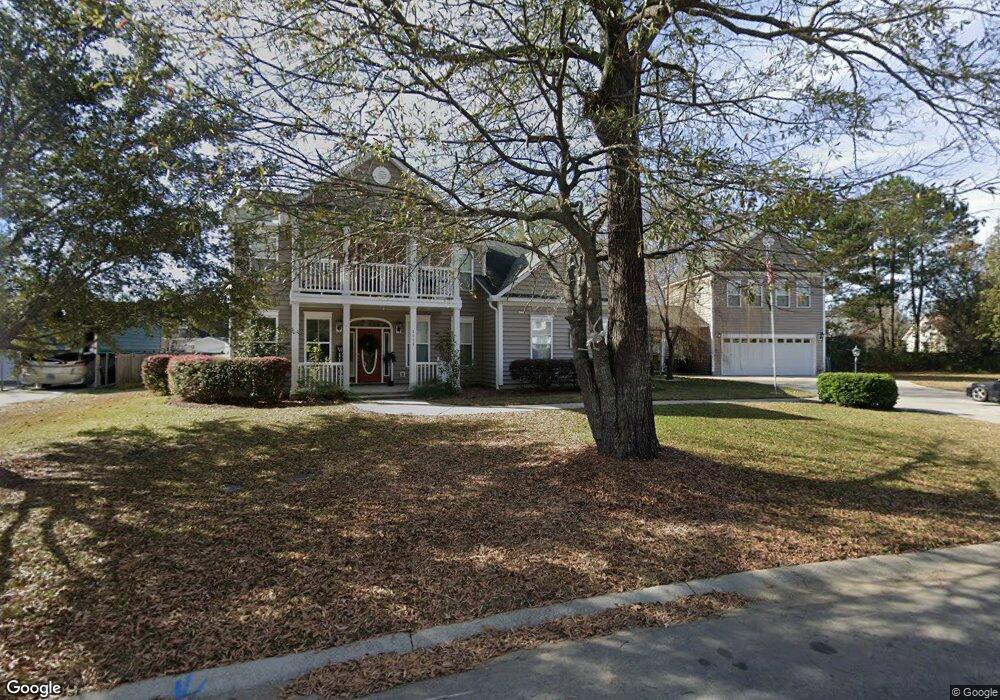
1113 Ole South Ct Moncks Corner, SC 29461
Estimated Value: $575,000 - $657,000
--
Bed
--
Bath
3,236
Sq Ft
$190/Sq Ft
Est. Value
About This Home
This home is located at 1113 Ole South Ct, Moncks Corner, SC 29461 and is currently estimated at $614,116, approximately $189 per square foot. 1113 Ole South Ct is a home located in Berkeley County with nearby schools including Moncks Corner Elementary School, Berkeley Middle School, and Berkeley High School.
Ownership History
Date
Name
Owned For
Owner Type
Purchase Details
Closed on
Mar 14, 2024
Sold by
Jordan Randy S and Jordan Dainette S
Bought by
Jordan Dainette S
Current Estimated Value
Purchase Details
Closed on
Oct 18, 2021
Sold by
Lucarelli Wendy W
Bought by
Ratliff Robert and Ratliff Michelle
Home Financials for this Owner
Home Financials are based on the most recent Mortgage that was taken out on this home.
Original Mortgage
$432,000
Interest Rate
2.8%
Mortgage Type
New Conventional
Purchase Details
Closed on
Jul 6, 2021
Sold by
Weathers Raymond H and Weathers Liloise W
Bought by
Weathers Living Trust and Weathers
Purchase Details
Closed on
Apr 14, 2021
Sold by
Brown Michael N and Brown Amy A
Bought by
Lacey Christopher Shane and Lacey Jennifer A
Home Financials for this Owner
Home Financials are based on the most recent Mortgage that was taken out on this home.
Original Mortgage
$392,000
Interest Rate
3.05%
Mortgage Type
New Conventional
Purchase Details
Closed on
Feb 18, 2021
Sold by
Cft12 Holdings 5 Llc
Bought by
Hic Stony Landing Llc
Home Financials for this Owner
Home Financials are based on the most recent Mortgage that was taken out on this home.
Original Mortgage
$392,000
Interest Rate
3.05%
Mortgage Type
New Conventional
Purchase Details
Closed on
Feb 3, 2021
Sold by
Corner Investors Llc
Bought by
Stony Landing Property Owners Association Inc
Home Financials for this Owner
Home Financials are based on the most recent Mortgage that was taken out on this home.
Original Mortgage
$4,000,000
Interest Rate
2.65%
Mortgage Type
Construction
Purchase Details
Closed on
Oct 23, 2017
Sold by
Brown Robert P and Brown Alice
Bought by
Brown Michael N and Brown Amy A
Home Financials for this Owner
Home Financials are based on the most recent Mortgage that was taken out on this home.
Original Mortgage
$315,425
Interest Rate
3.87%
Mortgage Type
FHA
Purchase Details
Closed on
Sep 29, 2017
Sold by
Cumbie John R
Bought by
Brown Robert P and Brown Alice
Home Financials for this Owner
Home Financials are based on the most recent Mortgage that was taken out on this home.
Original Mortgage
$315,425
Interest Rate
3.87%
Mortgage Type
FHA
Purchase Details
Closed on
Jun 17, 2004
Sold by
Wood John C and Wood Danielle J
Bought by
Brown Robert P and Brown Alice
Purchase Details
Closed on
Apr 23, 2004
Sold by
Laurel One Corp
Bought by
Wood John C and Wood Danielle J
Purchase Details
Closed on
Nov 5, 2003
Sold by
Cumbie John R
Bought by
Laurel One Corp
Create a Home Valuation Report for This Property
The Home Valuation Report is an in-depth analysis detailing your home's value as well as a comparison with similar homes in the area
Home Values in the Area
Average Home Value in this Area
Purchase History
| Date | Buyer | Sale Price | Title Company |
|---|---|---|---|
| Jordan Dainette S | -- | None Listed On Document | |
| Ratliff Robert | $480,000 | None Listed On Document | |
| Weathers Living Trust | -- | None Listed On Document | |
| Lacey Christopher Shane | $490,000 | None Available | |
| Lacey Christopher Shane | $490,000 | Title365 | |
| Hic Stony Landing Llc | $3,280,000 | None Listed On Document | |
| Stony Landing Property Owners Association Inc | -- | None Listed On Document | |
| Brown Michael N | $350,000 | None Available | |
| Brown Robert P | -- | None Available | |
| Brown Robert P | $45,000 | -- | |
| Wood John C | $39,900 | -- | |
| Laurel One Corp | $22,000 | -- |
Source: Public Records
Mortgage History
| Date | Status | Borrower | Loan Amount |
|---|---|---|---|
| Previous Owner | Ratliff Robert | $432,000 | |
| Previous Owner | Lacey Christopher Shane | $392,000 | |
| Previous Owner | Hic Stony Landing Llc | $4,000,000 | |
| Previous Owner | Brown Michael N | $315,425 |
Source: Public Records
Tax History Compared to Growth
Tax History
| Year | Tax Paid | Tax Assessment Tax Assessment Total Assessment is a certain percentage of the fair market value that is determined by local assessors to be the total taxable value of land and additions on the property. | Land | Improvement |
|---|---|---|---|---|
| 2025 | $3,481 | $574,900 | $95,000 | $479,900 |
| 2024 | $3,481 | $22,996 | $3,800 | $19,196 |
| 2023 | $3,481 | $22,996 | $3,800 | $19,196 |
| 2022 | $3,679 | $22,316 | $3,120 | $19,196 |
| 2021 | $2,514 | $15,480 | $2,720 | $12,760 |
| 2020 | $2,639 | $15,480 | $2,720 | $12,760 |
| 2019 | $2,605 | $15,480 | $2,720 | $12,760 |
| 2018 | $2,388 | $13,948 | $2,720 | $11,228 |
| 2017 | $1,915 | $12,856 | $2,720 | $10,136 |
| 2016 | $1,786 | $12,860 | $2,720 | $10,140 |
| 2015 | $6,034 | $12,860 | $2,720 | $10,140 |
| 2014 | $1,779 | $12,860 | $2,720 | $10,140 |
| 2013 | -- | $12,860 | $2,720 | $10,140 |
Source: Public Records
Map
Nearby Homes
- 1406 Cooper River Blvd
- 1401 Cooper River Blvd
- 414 Blue Elderberry Run
- 110 Cardinal Flower Ct
- 113 Cardinal Flower Ct
- 500 Shady Maple St
- 509 Shady Maple St
- 510 Shady Maple St
- 522 Shady Maple St
- 619 Red Mulberry Rd
- 1117 Quenby Ln
- 604 Red Mulberry Rd
- 407 Spruce Ivy St
- 1309 Dennis Blvd
- 220 N Highway 52
- 1802 Canal Dr
- 1407 Dennis Blvd
- 111 N Highway 52
- 126 U S 52
- 201 Cooper St
- 1113 Ole Ct S
- 1111 Ole South Ct
- 1114 Hollybrooke Dr
- 1111 Ole South Ct
- 1112 Hollybrooke Dr
- 1115 Ole Ct S
- 1115 Ole Ct
- 1110 Hollybrooke Dr
- 1115 Ole South Ct
- 1113 Hollybrooke Dr
- 1110 Ole South Ct
- 1108 Hollybrooke Dr
- 1110 Ole Ct S
- 1109 Ole South Ct
- 1109 Ole Ct
- 1114 Ole South Ct
- 1111 Hollybrooke Dr
- 1106 Hollybrooke Dr
- 1104 Hollybrooke Dr
- 1102 Hollybrooke Dr