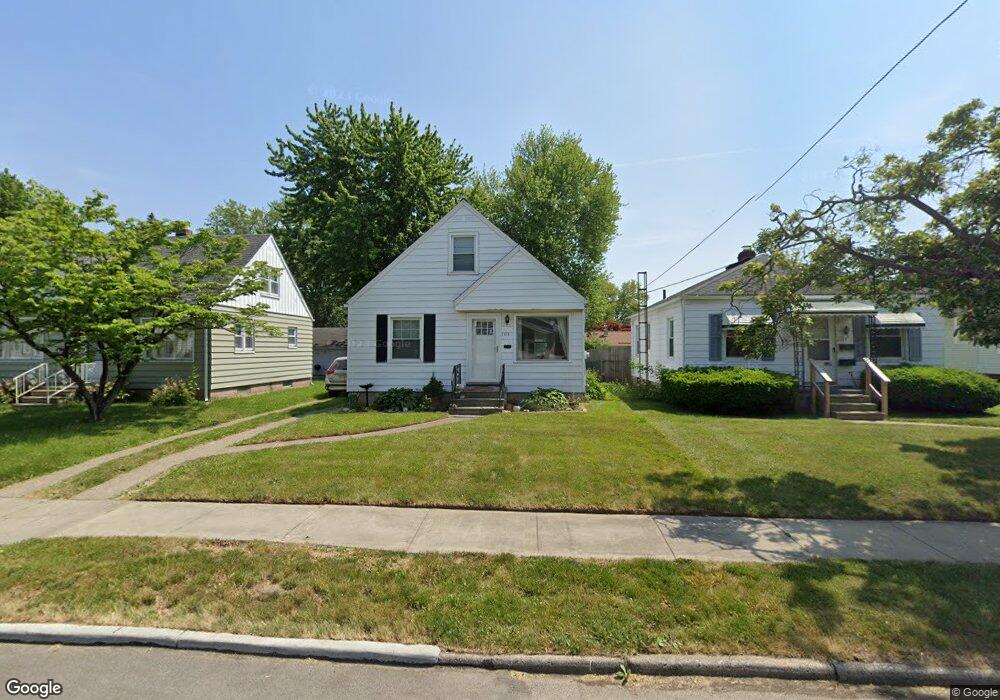
1113 Olson St Toledo, OH 43612
Five Points NeighborhoodEstimated Value: $103,000 - $139,000
3
Beds
1
Bath
1,080
Sq Ft
$108/Sq Ft
Est. Value
About This Home
This home is located at 1113 Olson St, Toledo, OH 43612 and is currently estimated at $116,228, approximately $107 per square foot. 1113 Olson St is a home located in Lucas County with nearby schools including Larchmont Elementary School, Start High School, and Bennett Venture Academy.
Ownership History
Date
Name
Owned For
Owner Type
Purchase Details
Closed on
Mar 15, 2010
Sold by
Savage Robert A and Savage Megan A
Bought by
Ichrist John L
Current Estimated Value
Home Financials for this Owner
Home Financials are based on the most recent Mortgage that was taken out on this home.
Original Mortgage
$77,077
Outstanding Balance
$51,799
Interest Rate
5.5%
Mortgage Type
FHA
Estimated Equity
$64,429
Purchase Details
Closed on
Jul 31, 2003
Sold by
Tippey Alice and Tippey Alice R
Bought by
Savage Robert A
Home Financials for this Owner
Home Financials are based on the most recent Mortgage that was taken out on this home.
Original Mortgage
$87,650
Interest Rate
5%
Mortgage Type
Purchase Money Mortgage
Create a Home Valuation Report for This Property
The Home Valuation Report is an in-depth analysis detailing your home's value as well as a comparison with similar homes in the area
Home Values in the Area
Average Home Value in this Area
Purchase History
| Date | Buyer | Sale Price | Title Company |
|---|---|---|---|
| Ichrist John L | $78,500 | Louisville | |
| Savage Robert A | $87,700 | Northwest Title Agency Of Oh |
Source: Public Records
Mortgage History
| Date | Status | Borrower | Loan Amount |
|---|---|---|---|
| Open | Ichrist John L | $77,077 | |
| Previous Owner | Savage Robert A | $87,650 |
Source: Public Records
Tax History
| Year | Tax Paid | Tax Assessment Tax Assessment Total Assessment is a certain percentage of the fair market value that is determined by local assessors to be the total taxable value of land and additions on the property. | Land | Improvement |
|---|---|---|---|---|
| 2025 | -- | $22,400 | $8,435 | $13,965 |
| 2024 | $700 | $22,400 | $8,435 | $13,965 |
| 2023 | $1,374 | $21,140 | $6,195 | $14,945 |
| 2022 | $1,378 | $21,140 | $6,195 | $14,945 |
| 2021 | $1,411 | $21,140 | $6,195 | $14,945 |
| 2020 | $1,364 | $17,955 | $5,250 | $12,705 |
| 2019 | $1,324 | $17,955 | $5,250 | $12,705 |
| 2018 | $1,343 | $17,955 | $5,250 | $12,705 |
| 2017 | $1,365 | $17,570 | $5,145 | $12,425 |
| 2016 | $1,366 | $50,200 | $14,700 | $35,500 |
| 2015 | $1,355 | $50,200 | $14,700 | $35,500 |
| 2014 | $1,106 | $17,580 | $5,150 | $12,430 |
| 2013 | $1,106 | $17,580 | $5,150 | $12,430 |
Source: Public Records
Map
Nearby Homes
- 1023 Hawk St
- 4623 Lewis Ave
- 815 W Capistrano Ave
- 826 W Gramercy Ave
- 904 Annabelle Dr
- 5113 Tappan Ave
- 4612 Willys Pkwy
- 840 Southover Rd
- 5145 Ford Ave
- 706 W Gramercy Ave
- 1344 Corbin Rd
- 4510 Eastway St
- 4703 Vermaas Ave
- 1351 Corbin Rd
- 1425 Hagley Rd
- 4449 Burnham Ave
- 1013 Clymena St
- 4406 Asbury Dr
- 539 Sunset Blvd
- 702 Mayfair Blvd
Your Personal Tour Guide
Ask me questions while you tour the home.