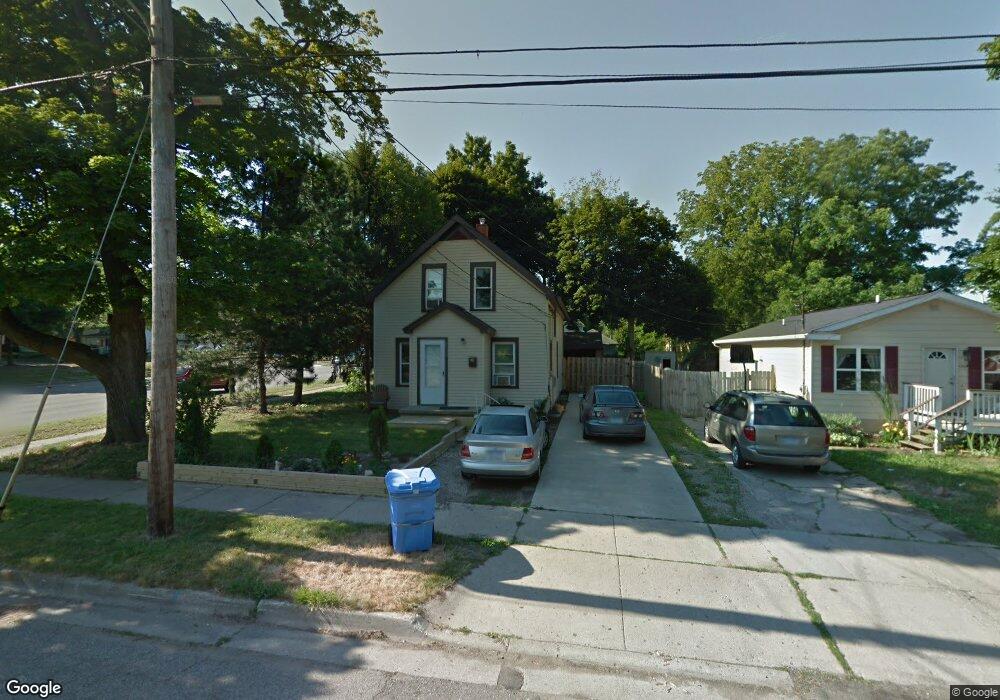
1113 Pulaski St Lansing, MI 48910
Quentin Park NeighborhoodEstimated Value: $143,366 - $189,000
Studio
--
Bath
1,400
Sq Ft
$117/Sq Ft
Est. Value
About This Home
This home is located at 1113 Pulaski St, Lansing, MI 48910 and is currently estimated at $163,842, approximately $117 per square foot. 1113 Pulaski St is a home located in Ingham County with nearby schools including Averill Elementary School, Pattengill Academy, and J.W. Sexton High School.
Ownership History
Date
Name
Owned For
Owner Type
Purchase Details
Closed on
Nov 2, 2023
Sold by
Rebecca Lindsey-Kennedy Living Trust
Bought by
Lindsey Dakota James
Current Estimated Value
Home Financials for this Owner
Home Financials are based on the most recent Mortgage that was taken out on this home.
Original Mortgage
$60,800
Outstanding Balance
$59,454
Interest Rate
7.19%
Mortgage Type
New Conventional
Estimated Equity
$104,388
Purchase Details
Closed on
Jan 5, 2018
Sold by
Kennedy Rebecca Lindsey
Bought by
Rebecca Lindsey Kennedy Living Trust
Purchase Details
Closed on
Aug 26, 2004
Sold by
Jpmorgan Chase Bank
Bought by
Tcif Reo 1 Llc
Purchase Details
Closed on
Mar 18, 2004
Sold by
Moore Micah and Moore Sarah
Bought by
Mortgage Electronic Registration Systems
Purchase Details
Closed on
Sep 30, 2002
Sold by
Vanderlip Michael and Vanderlip Patricia
Bought by
Moore Micah and Moore Sarah
Create a Home Valuation Report for This Property
The Home Valuation Report is an in-depth analysis detailing your home's value as well as a comparison with similar homes in the area
Home Values in the Area
Average Home Value in this Area
Purchase History
| Date | Buyer | Sale Price | Title Company |
|---|---|---|---|
| Lindsey Dakota James | $101,000 | Red Cedar Title | |
| Rebecca Lindsey Kennedy Living Trust | -- | None Available | |
| Tcif Reo 1 Llc | -- | E Title Agency | |
| Jpmorgan Chase Bank | -- | E Title Agency | |
| Mortgage Electronic Registration Systems | $58,400 | -- | |
| Moore Micah | $66,000 | Nations Title | |
| Vanderlip Michael | $58,000 | Nations Title |
Source: Public Records
Mortgage History
| Date | Status | Borrower | Loan Amount |
|---|---|---|---|
| Open | Lindsey Dakota James | $60,800 |
Source: Public Records
Tax History
| Year | Tax Paid | Tax Assessment Tax Assessment Total Assessment is a certain percentage of the fair market value that is determined by local assessors to be the total taxable value of land and additions on the property. | Land | Improvement |
|---|---|---|---|---|
| 2025 | $2,852 | $78,200 | $7,300 | $70,900 |
| 2024 | $23 | $64,900 | $7,300 | $57,600 |
| 2023 | $3,398 | $57,800 | $7,300 | $50,500 |
| 2022 | $3,101 | $52,900 | $8,200 | $44,700 |
| 2021 | $3,029 | $49,000 | $6,500 | $42,500 |
| 2020 | $3,008 | $45,700 | $6,500 | $39,200 |
| 2019 | $2,908 | $42,100 | $6,500 | $35,600 |
| 2018 | $2,756 | $38,400 | $6,500 | $31,900 |
| 2017 | $2,653 | $38,400 | $6,500 | $31,900 |
| 2016 | $2,548 | $36,700 | $6,500 | $30,200 |
| 2015 | $2,548 | $35,500 | $13,005 | $22,495 |
| 2014 | $2,548 | $34,100 | $15,313 | $18,787 |
Source: Public Records
Map
Nearby Homes
- 1120 Alsdorf St
- 1221 Moores River Dr
- 1400 Pico Ave
- 1309 Hammond St
- 1327 Moores River Dr
- 1319 Pico Ave
- 1511 Pattengill Ave
- 1017 W Barnes Ave
- 1116 George St
- 1516 Moores River Dr
- 1114 Goodrich St
- 815 Smith Ave
- 1312 W Mount Hope Ave
- 717 Smith Ave
- 900 W Mount Hope Ave
- 2001 S Martin Luther King Junior Blvd
- 900 Middle St
- 1723 Osband Ave
- 1912 Moores River Dr
- 1740 Wellington Rd Unit 103
- 1117 Pulaski St
- 1121 Pulaski St
- 1114 Alsdorf St
- 1127 Pulaski St
- 1201 Pulaski St
- 1126 Alsdorf St
- 1118 Pulaski St
- 1205 Pulaski St
- 1122 Pulaski St
- 1200 Alsdorf St
- 1022 Braman St
- 1126 Pulaski St
- 1207 Pulaski St
- 1204 Alsdorf St
- 1027 Braman St
- 1211 Pulaski St
- 1202 Pulaski St
- 1210 Alsdorf St
- 1020 Braman St
- 1025 Braman St
Your Personal Tour Guide
Ask me questions while you tour the home.