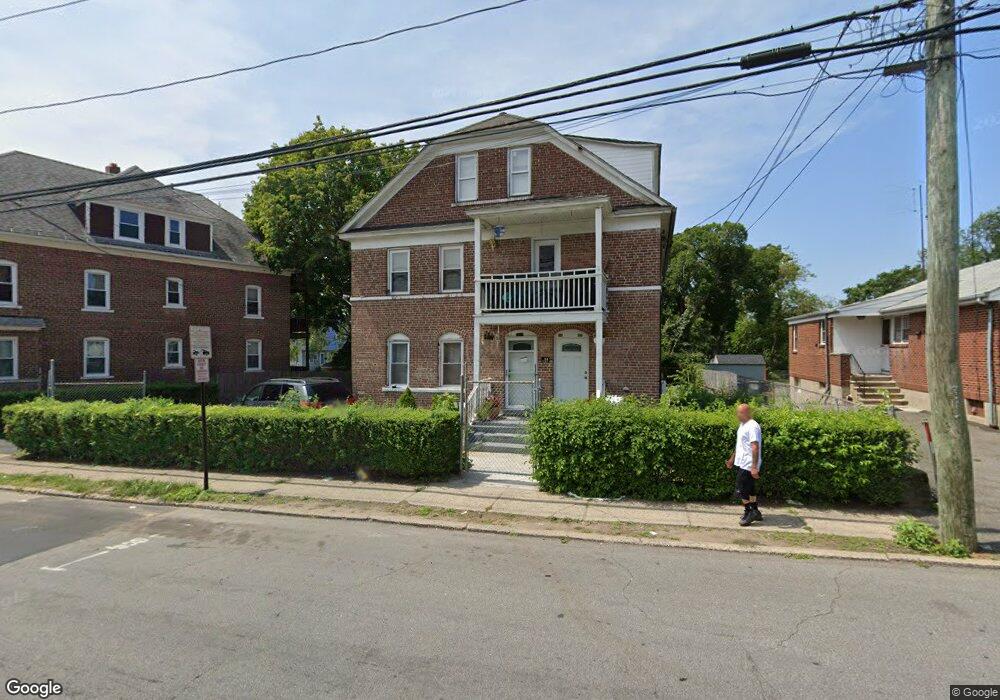
1113 Reservoir Ave Unit 1117 Bridgeport, CT 06606
Reservoir-Whiskey Hill NeighborhoodEstimated Value: $586,000 - $748,000
6
Beds
3
Baths
2,850
Sq Ft
$230/Sq Ft
Est. Value
About This Home
This home is located at 1113 Reservoir Ave Unit 1117, Bridgeport, CT 06606 and is currently estimated at $656,667, approximately $230 per square foot. 1113 Reservoir Ave Unit 1117 is a home located in Fairfield County with nearby schools including Hallen School, Central High School, and Northeastern Adventist Academy - Fairfield County.
Ownership History
Date
Name
Owned For
Owner Type
Purchase Details
Closed on
Aug 12, 2009
Sold by
American Home Mtg Svcn
Bought by
Smith Calbert W
Current Estimated Value
Home Financials for this Owner
Home Financials are based on the most recent Mortgage that was taken out on this home.
Original Mortgage
$137,464
Interest Rate
5.36%
Purchase Details
Closed on
Aug 29, 2005
Sold by
Welcome Ana
Bought by
Lopez Francisco
Purchase Details
Closed on
Jun 4, 2004
Sold by
Brano Jose
Bought by
Welcome Ana
Purchase Details
Closed on
Aug 3, 1999
Sold by
Turchiano Frank
Bought by
Bravo Jose
Purchase Details
Closed on
Jul 16, 1999
Sold by
Giacobbe Phyllis M
Bought by
Turchiano Frank
Create a Home Valuation Report for This Property
The Home Valuation Report is an in-depth analysis detailing your home's value as well as a comparison with similar homes in the area
Home Values in the Area
Average Home Value in this Area
Purchase History
| Date | Buyer | Sale Price | Title Company |
|---|---|---|---|
| Smith Calbert W | $140,000 | -- | |
| Smith Calbert W | $140,000 | -- | |
| Lopez Francisco | $320,000 | -- | |
| Lopez Francisco | $320,000 | -- | |
| Welcome Ana | $184,500 | -- | |
| Welcome Ana | $184,500 | -- | |
| Bravo Jose | $136,000 | -- | |
| Bravo Jose | $136,000 | -- | |
| Turchiano Frank | $85,000 | -- | |
| Turchiano Frank | $85,000 | -- |
Source: Public Records
Mortgage History
| Date | Status | Borrower | Loan Amount |
|---|---|---|---|
| Open | Turchiano Frank | $142,500 | |
| Closed | Turchiano Frank | $137,464 |
Source: Public Records
Tax History Compared to Growth
Tax History
| Year | Tax Paid | Tax Assessment Tax Assessment Total Assessment is a certain percentage of the fair market value that is determined by local assessors to be the total taxable value of land and additions on the property. | Land | Improvement |
|---|---|---|---|---|
| 2025 | $8,544 | $196,642 | $59,312 | $137,330 |
| 2024 | $8,544 | $196,642 | $59,312 | $137,330 |
| 2023 | $8,544 | $196,642 | $59,312 | $137,330 |
| 2022 | $8,544 | $196,642 | $59,312 | $137,330 |
| 2021 | $8,544 | $196,642 | $59,312 | $137,330 |
| 2020 | $8,086 | $149,760 | $34,130 | $115,630 |
| 2019 | $8,086 | $149,760 | $34,130 | $115,630 |
| 2018 | $8,142 | $149,760 | $34,130 | $115,630 |
| 2017 | $8,142 | $149,760 | $34,130 | $115,630 |
| 2016 | $8,142 | $149,760 | $34,130 | $115,630 |
| 2015 | $8,320 | $197,150 | $39,140 | $158,010 |
| 2014 | $8,320 | $197,150 | $39,140 | $158,010 |
Source: Public Records
Map
Nearby Homes
- 717 Reservoir Ave
- 705 Reservoir Ave
- 36 Platt St
- 438 Soundview Ave
- 130 Wilkins Ave
- 110 Wilkins Ave
- 1053 Sylvan Ave
- 28 Wilkins Ave
- 769 Sylvan Ave Unit 16
- 769 Sylvan Ave Unit 13
- 285 Alba Ave
- 410 Alba Ave
- 15 Edwards St
- 181 Cityview Ave
- 1088 Sylvan Ave
- 165 Yaremich Dr
- 26 Karen Ct Unit A
- 45 Polk St
- 32 Karen Ct Unit b
- 365 Platt St
- 1123 Reservoir Ave
- 1122 Reservoir Ave
- 1097 Reservoir Ave Unit 2
- 1106 Reservoir Ave
- 1100 Reservoir Ave
- 1137 Reservoir Ave
- 21 Alba Ave
- 1095 Reservoir Ave
- 243 Ortega Ave
- 50 Lansing Place
- 1094 Reservoir Ave
- 39 Alba Ave
- 233 Ortega Ave
- 1157 Reservoir Ave
- 25 Lansing Place
- 1112 Reservoir Ave
- 35 Lansing Place
- 1056 Reservoir Ave
- 27 Lansing Place
- 37 Lansing Place