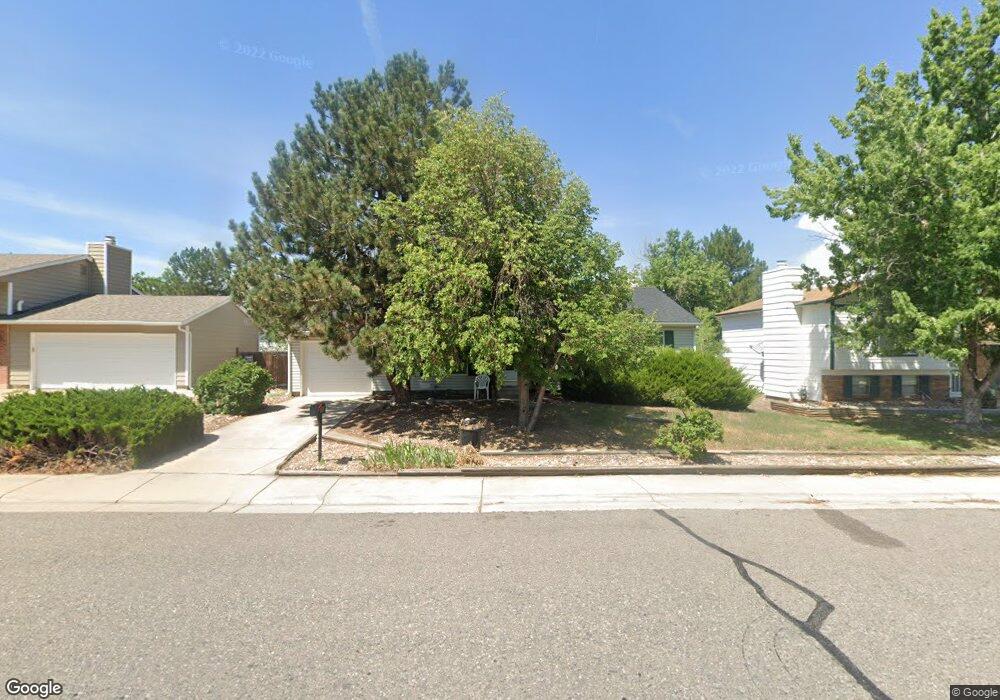
1113 S Lewiston St Aurora, CO 80017
Rocky Ridge NeighborhoodEstimated Value: $428,562 - $470,000
3
Beds
2
Baths
1,028
Sq Ft
$431/Sq Ft
Est. Value
About This Home
This home is located at 1113 S Lewiston St, Aurora, CO 80017 and is currently estimated at $443,141, approximately $431 per square foot. 1113 S Lewiston St is a home located in Arapahoe County with nearby schools including Iowa Elementary School, Mrachek Middle School, and Gateway High School.
Ownership History
Date
Name
Owned For
Owner Type
Purchase Details
Closed on
May 18, 2016
Sold by
Obcena Melissa A
Bought by
Daly Rafid Al
Current Estimated Value
Home Financials for this Owner
Home Financials are based on the most recent Mortgage that was taken out on this home.
Original Mortgage
$200,000
Outstanding Balance
$158,850
Interest Rate
3.59%
Mortgage Type
New Conventional
Estimated Equity
$284,291
Purchase Details
Closed on
Sep 30, 2011
Sold by
Shortell Stephen
Bought by
Obcena Melissa A
Home Financials for this Owner
Home Financials are based on the most recent Mortgage that was taken out on this home.
Original Mortgage
$132,795
Interest Rate
4.24%
Mortgage Type
VA
Purchase Details
Closed on
May 2, 2008
Sold by
Ba Nulife Investments Llc
Bought by
Shortell Stephen
Home Financials for this Owner
Home Financials are based on the most recent Mortgage that was taken out on this home.
Original Mortgage
$145,445
Interest Rate
5.86%
Mortgage Type
FHA
Purchase Details
Closed on
Nov 9, 2007
Sold by
Ridgemoor Realty Inc
Bought by
B A Nulife Investments Llc
Home Financials for this Owner
Home Financials are based on the most recent Mortgage that was taken out on this home.
Original Mortgage
$126,000
Interest Rate
6.38%
Mortgage Type
Construction
Purchase Details
Closed on
Oct 9, 2007
Sold by
Villiers Charlotte K and Estate Of Dorothy L Ashcraft
Bought by
Ridgemoor Realty Inc
Home Financials for this Owner
Home Financials are based on the most recent Mortgage that was taken out on this home.
Original Mortgage
$126,000
Interest Rate
6.38%
Mortgage Type
Construction
Purchase Details
Closed on
Jul 22, 1988
Sold by
Secretary Of Housing & Urban Dev
Bought by
Ashcraft Dorothy L
Purchase Details
Closed on
Mar 24, 1988
Sold by
Gmac Mortgage Corp Of Pa Gmac Mortgage P
Bought by
Secretary Of Housing & Urban Dev
Purchase Details
Closed on
Feb 25, 1988
Sold by
Thompson James J Thompson Rhonda K
Bought by
Gmac Mortgage Corp Of Pa Gmac Mortgage P
Purchase Details
Closed on
Dec 22, 1986
Sold by
Conversion Arapco
Bought by
Thompson James J Thompson Rhonda K
Purchase Details
Closed on
May 1, 1982
Sold by
Conversion Arapco
Bought by
Conversion Arapco
Purchase Details
Closed on
Apr 1, 1978
Sold by
Conversion Arapco
Bought by
Conversion Arapco
Purchase Details
Closed on
Jul 4, 1776
Bought by
Conversion Arapco
Create a Home Valuation Report for This Property
The Home Valuation Report is an in-depth analysis detailing your home's value as well as a comparison with similar homes in the area
Home Values in the Area
Average Home Value in this Area
Purchase History
| Date | Buyer | Sale Price | Title Company |
|---|---|---|---|
| Daly Rafid Al | $250,000 | First American Title Ins Co | |
| Obcena Melissa A | $133,000 | Assured Title | |
| Shortell Stephen | $147,500 | 1Dt | |
| B A Nulife Investments Llc | $95,000 | Land Title | |
| Ridgemoor Realty Inc | $80,000 | Land Title | |
| Ashcraft Dorothy L | -- | -- | |
| Secretary Of Housing & Urban Dev | -- | -- | |
| Gmac Mortgage Corp Of Pa Gmac Mortgage P | -- | -- | |
| Thompson James J Thompson Rhonda K | -- | -- | |
| Conversion Arapco | -- | -- | |
| Conversion Arapco | -- | -- | |
| Conversion Arapco | -- | -- |
Source: Public Records
Mortgage History
| Date | Status | Borrower | Loan Amount |
|---|---|---|---|
| Open | Daly Rafid Al | $200,000 | |
| Previous Owner | Obcena Melissa A | $132,795 | |
| Previous Owner | Shortell Stephen | $145,445 | |
| Previous Owner | B A Nulife Investments Llc | $126,000 | |
| Previous Owner | Ridgemoor Realty Inc | $72,000 |
Source: Public Records
Tax History Compared to Growth
Tax History
| Year | Tax Paid | Tax Assessment Tax Assessment Total Assessment is a certain percentage of the fair market value that is determined by local assessors to be the total taxable value of land and additions on the property. | Land | Improvement |
|---|---|---|---|---|
| 2024 | $2,513 | $27,115 | -- | -- |
| 2023 | $2,513 | $27,035 | $0 | $0 |
| 2022 | $2,382 | $23,727 | $0 | $0 |
| 2021 | $2,459 | $23,727 | $0 | $0 |
| 2020 | $2,297 | $22,064 | $0 | $0 |
| 2019 | $2,285 | $22,064 | $0 | $0 |
| 2018 | $1,939 | $18,338 | $0 | $0 |
| 2017 | $1,687 | $18,338 | $0 | $0 |
| 2016 | $1,336 | $14,216 | $0 | $0 |
| 2015 | $1,289 | $14,216 | $0 | $0 |
| 2014 | $954 | $10,125 | $0 | $0 |
| 2013 | -- | $11,320 | $0 | $0 |
Source: Public Records
Map
Nearby Homes
- 1140 S Kittredge St
- 16233 E Louisiana Place
- 1305 S Laredo Ct
- 1024 S Mobile St
- 15810 E Arkansas Dr
- 16325 E Alabama Dr
- 16506 E Arizona Dr
- 1409 S Joplin St
- 1262 S Olathe Way
- 16651 E Arizona Place
- 16405 E Kentucky Ave
- 16673 E Louisiana Dr
- 1350 S Idalia St Unit G
- 1323 S Idalia St
- 15475 E Louisiana Ave
- 16333 E Carolina Dr
- 16634 E Louisiana Dr
- 1462 S Laredo Way
- 16555 E Arkansas Ave
- 15574 E Wyoming Dr Unit D
- 1121 S Lewiston St
- 1111 S Lewiston St
- 1130 S Kittredge St
- 1120 S Kittredge St
- 1103 S Lewiston St
- 1131 S Lewiston St
- 1110 S Kittredge St
- 1150 S Kittredge St
- 1141 S Lewiston St
- 1101 S Lewiston St
- 1160 S Kittredge St
- 1100 S Kittredge St
- 1139 S Kittredge St
- 1129 S Kittredge St
- 1151 S Lewiston St
- 1119 S Kittredge St
- 1170 S Kittredge St
- 0 S Kittredge St Unit 2726844
- 0 S Kittredge St Unit 3727236
- 0 S Kittredge St