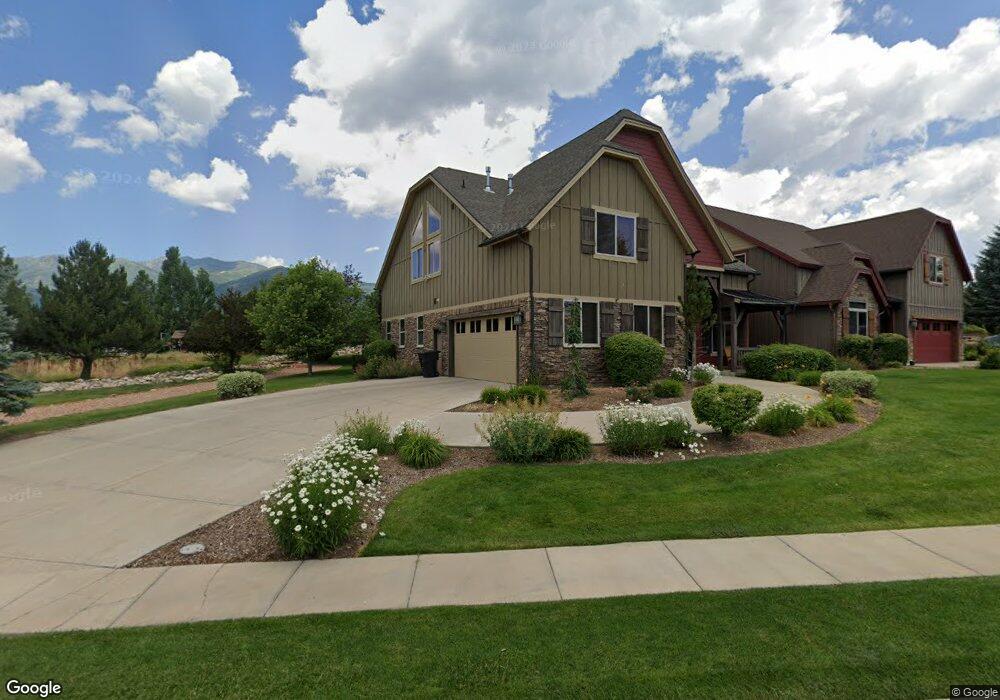
1113 Springer View Dr Midway, UT 84049
Estimated Value: $1,070,000 - $1,312,000
4
Beds
4
Baths
4,408
Sq Ft
$261/Sq Ft
Est. Value
About This Home
This home is located at 1113 Springer View Dr, Midway, UT 84049 and is currently estimated at $1,152,053, approximately $261 per square foot. 1113 Springer View Dr is a home located in Wasatch County with nearby schools including Midway Elementary School, Rocky Mountain Middle School, and Wasatch High School.
Ownership History
Date
Name
Owned For
Owner Type
Purchase Details
Closed on
Apr 29, 2008
Sold by
Skyline Holdings Group Llc
Bought by
Wade James E and Wade Sharon K
Current Estimated Value
Purchase Details
Closed on
Mar 27, 2008
Sold by
Naylor Michael J
Bought by
Ron Myers & Skyline Holdings Llc
Purchase Details
Closed on
Jun 1, 2006
Sold by
Haws Scott and Haws Renee
Bought by
Naylor Michael J
Home Financials for this Owner
Home Financials are based on the most recent Mortgage that was taken out on this home.
Original Mortgage
$517,500
Interest Rate
7%
Mortgage Type
Balloon
Purchase Details
Closed on
Oct 12, 2005
Sold by
Canyonview Development Llc
Bought by
Pebble Creek Homes
Home Financials for this Owner
Home Financials are based on the most recent Mortgage that was taken out on this home.
Original Mortgage
$175,000
Interest Rate
10%
Mortgage Type
Purchase Money Mortgage
Create a Home Valuation Report for This Property
The Home Valuation Report is an in-depth analysis detailing your home's value as well as a comparison with similar homes in the area
Home Values in the Area
Average Home Value in this Area
Purchase History
| Date | Buyer | Sale Price | Title Company |
|---|---|---|---|
| Wade James E | -- | Select Title Ins Agency | |
| Wade James E | -- | Select Title Ins Agency | |
| Ron Myers & Skyline Holdings Llc | -- | None Available | |
| Naylor Michael J | -- | Atlas Title Insurance | |
| Pebble Creek Homes | -- | Atlas Title Insurance |
Source: Public Records
Mortgage History
| Date | Status | Borrower | Loan Amount |
|---|---|---|---|
| Previous Owner | Naylor Michael J | $517,500 | |
| Previous Owner | Pebble Creek Homes | $175,000 |
Source: Public Records
Tax History
| Year | Tax Paid | Tax Assessment Tax Assessment Total Assessment is a certain percentage of the fair market value that is determined by local assessors to be the total taxable value of land and additions on the property. | Land | Improvement |
|---|---|---|---|---|
| 2025 | $9,368 | $1,016,620 | $200,000 | $816,620 |
| 2024 | $8,028 | $881,090 | $135,000 | $746,090 |
| 2023 | $8,028 | $1,000,000 | $135,000 | $865,000 |
| 2022 | $9,697 | $967,050 | $135,000 | $832,050 |
| 2021 | $8,365 | $644,700 | $135,000 | $509,700 |
| 2020 | $8,627 | $644,700 | $135,000 | $509,700 |
| 2019 | $8,136 | $664,726 | $0 | $0 |
| 2018 | $8,136 | $664,726 | $0 | $0 |
| 2017 | $6,035 | $490,186 | $0 | $0 |
| 2016 | $6,188 | $490,186 | $0 | $0 |
| 2015 | $5,879 | $490,186 | $100,000 | $390,186 |
| 2014 | $6,118 | $490,186 | $100,000 | $390,186 |
Source: Public Records
Map
Nearby Homes
- 363 W 1150 N
- 1126 Springer View Loop
- 1195 Canyon View Rd
- 1524 Canyon View Rd Unit 1
- 269 W Canyon View Ln
- 554 N 1150 Unit 47
- 554 W 1150 N
- 92 W Village Ct
- 308 Pine Canyon Rd Unit 14-387
- 1182 N Canyon View Rd Unit 11
- 1238 N Canyon View Rd
- 1182 N Canyon View Rd
- 57 W Oberland Ct
- 49 W Oberland Ct
- 5 E Village Cir
- 314 W Lady Bank Ln
- 1441 N Jerry Gertsch Ln
- 1524 N Canyon View Rd
- 700 N Homestead Dr Unit 23-101
- 700 N Homestead Dr Unit Bldg 23 Unit 105
- 1113 Springerview Dr
- 1103 Springerview Dr
- 1119 N Springer View Dr
- 1119 Springerview Dr
- 1133 Springerview Dr
- 1133 N Springer View Dr
- 1088 N Springer View Dr
- 1088 Springerview Dr
- 1139 Springerview Dr
- 1139 N Springer View Dr
- 1139 N Springer View Dr Unit 1139
- 1102 N Springer View Dr
- 1102 Springerview Dr
- 1108 N Springer View Dr
- 1108 Springerview Dr
- 1108 Springerview Dr Unit 13
- 1082 N Springer View Dr
- 1082 Springerview Dr
- 349 N 1150
- 1120 Springer View Dr
Your Personal Tour Guide
Ask me questions while you tour the home.