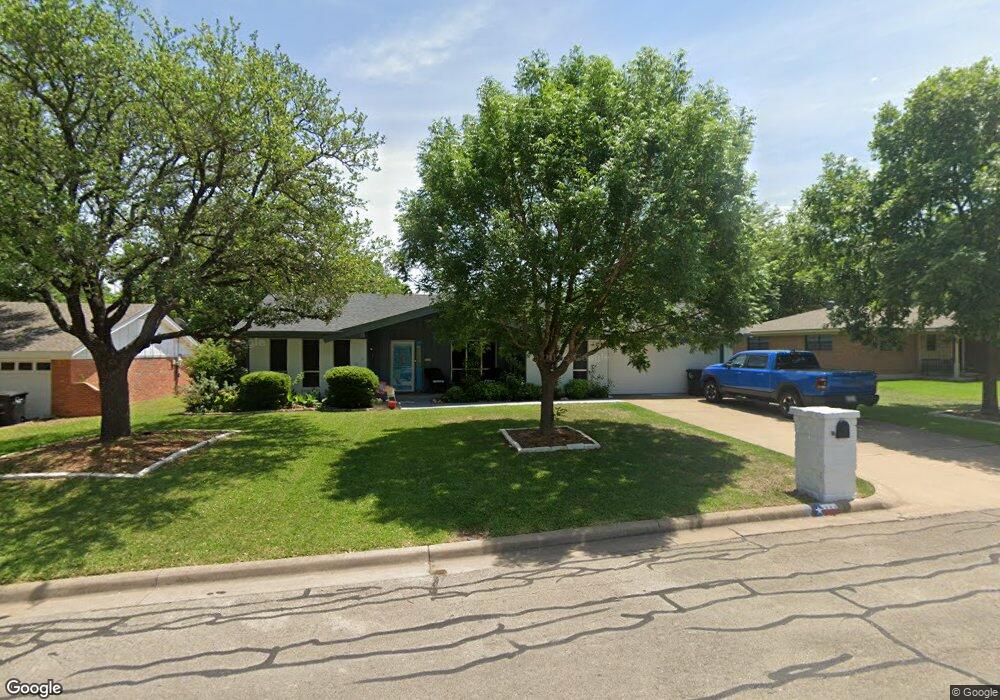
1113 Trace Rd Cleburne, TX 76033
Estimated Value: $280,000 - $313,000
3
Beds
2
Baths
1,858
Sq Ft
$162/Sq Ft
Est. Value
About This Home
This home is located at 1113 Trace Rd, Cleburne, TX 76033 and is currently estimated at $300,380, approximately $161 per square foot. 1113 Trace Rd is a home located in Johnson County with nearby schools including Coleman Elementary School, Lowell Smith Jr. Middle School, and Cleburne High School.
Ownership History
Date
Name
Owned For
Owner Type
Purchase Details
Closed on
Aug 30, 2012
Sold by
Moss Beverly
Bought by
Box Lisa A
Current Estimated Value
Home Financials for this Owner
Home Financials are based on the most recent Mortgage that was taken out on this home.
Original Mortgage
$106,534
Outstanding Balance
$74,340
Interest Rate
3.75%
Mortgage Type
FHA
Estimated Equity
$226,040
Purchase Details
Closed on
Oct 4, 2011
Sold by
Secretary Of Hud
Bought by
Moss Beverly
Purchase Details
Closed on
Mar 3, 2011
Sold by
Chase Home Finance Llc
Bought by
The Secretary Of Hud
Purchase Details
Closed on
Mar 1, 2011
Sold by
Allmon Edward
Bought by
Chase Home Finance Llc
Purchase Details
Closed on
Nov 22, 2008
Sold by
Balley Eben H and Bailey Ellen
Bought by
Allmon Edward
Home Financials for this Owner
Home Financials are based on the most recent Mortgage that was taken out on this home.
Original Mortgage
$141,234
Interest Rate
5.99%
Mortgage Type
Purchase Money Mortgage
Create a Home Valuation Report for This Property
The Home Valuation Report is an in-depth analysis detailing your home's value as well as a comparison with similar homes in the area
Home Values in the Area
Average Home Value in this Area
Purchase History
| Date | Buyer | Sale Price | Title Company |
|---|---|---|---|
| Box Lisa A | -- | None Available | |
| Moss Beverly | -- | None Available | |
| The Secretary Of Hud | -- | None Available | |
| Chase Home Finance Llc | $164,583 | None Available | |
| Allmon Edward | -- | Rtt |
Source: Public Records
Mortgage History
| Date | Status | Borrower | Loan Amount |
|---|---|---|---|
| Open | Box Lisa A | $106,534 | |
| Previous Owner | Allmon Edward | $141,234 |
Source: Public Records
Tax History Compared to Growth
Tax History
| Year | Tax Paid | Tax Assessment Tax Assessment Total Assessment is a certain percentage of the fair market value that is determined by local assessors to be the total taxable value of land and additions on the property. | Land | Improvement |
|---|---|---|---|---|
| 2025 | $4,598 | $298,118 | $65,000 | $233,118 |
| 2024 | $6,025 | $270,196 | $0 | $0 |
| 2023 | $4,079 | $298,118 | $65,000 | $233,118 |
| 2022 | $5,588 | $266,962 | $55,000 | $211,962 |
| 2021 | $5,297 | $237,778 | $45,000 | $192,778 |
| 2020 | $4,824 | $174,089 | $30,000 | $144,089 |
| 2019 | $5,144 | $174,093 | $30,000 | $144,093 |
| 2018 | $4,975 | $174,093 | $30,000 | $144,093 |
| 2017 | $4,504 | $153,010 | $25,000 | $128,010 |
| 2016 | $4,156 | $141,170 | $25,000 | $116,170 |
| 2015 | $2,858 | $141,170 | $25,000 | $116,170 |
| 2014 | $2,858 | $119,479 | $25,000 | $94,479 |
Source: Public Records
Map
Nearby Homes
- 1103 Trace Rd
- 1116 Willowcreek Rd
- 1115 Green River Trail
- 4112 Highland Dr
- 4101 Highland Dr
- 1204 W Westhill Dr
- 909 Highland Dr
- 1211 Greenbriar Ln
- 840 S Ridgeway Dr
- 1225 Crestwood Dr
- 1208 Cindy Ln
- 1104 Cherrywood Dr
- 806 S Colonial Dr
- 311 Sunset Dr
- 616 Bellevue Dr
- 215 Sunset Dr
- 504 S Colonial Dr
- 1302 Cindy Ct
- 1104 Lynnwood Dr
- 800 Misty Ln
- 1402 Trace Rd
- 1115 Trace Rd
- 1111 Trace Rd
- 1112 Willowcreek Rd
- 1110 Willowcreek Rd
- 1112 Trace Rd
- 1117 Trace Rd
- 1109 Trace Rd
- 1114 Willowcreek Rd
- 1114 Trace Rd
- 1110 Trace Rd
- 1108 Willowcreek Rd
- 1116 Trace Rd
- 1107 Trace Rd
- 1119 Trace Rd
- 1401 Trace Rd
- 1106 Willowcreek Rd
- 1106 Trace Rd
- 1109 W Westhill Dr
- 1113 Willowcreek Rd